
Enable Tracing in Prompt flow
Working with Generative AI is cool. As a user, you mostly see the chatbot as frontend of an AI application with amazing results produced by Large Language Models (LLMs). However, as a developer, I need more insights during the development phase. Specifically, I want to know what information is being passed to my LLM. That’s why I usually enable tracing for my AI applications, but how can I do this in Prompt flow?
That is not so difficult. So let me explain how I enable tracing for Prompt flow one of my examples. Remember I recently developed a Joke Generator with Prompty. Furthermore, I generated for the Prompty file a simple Prompt flow that I use to run my AI application. Right now, this application works as expected.
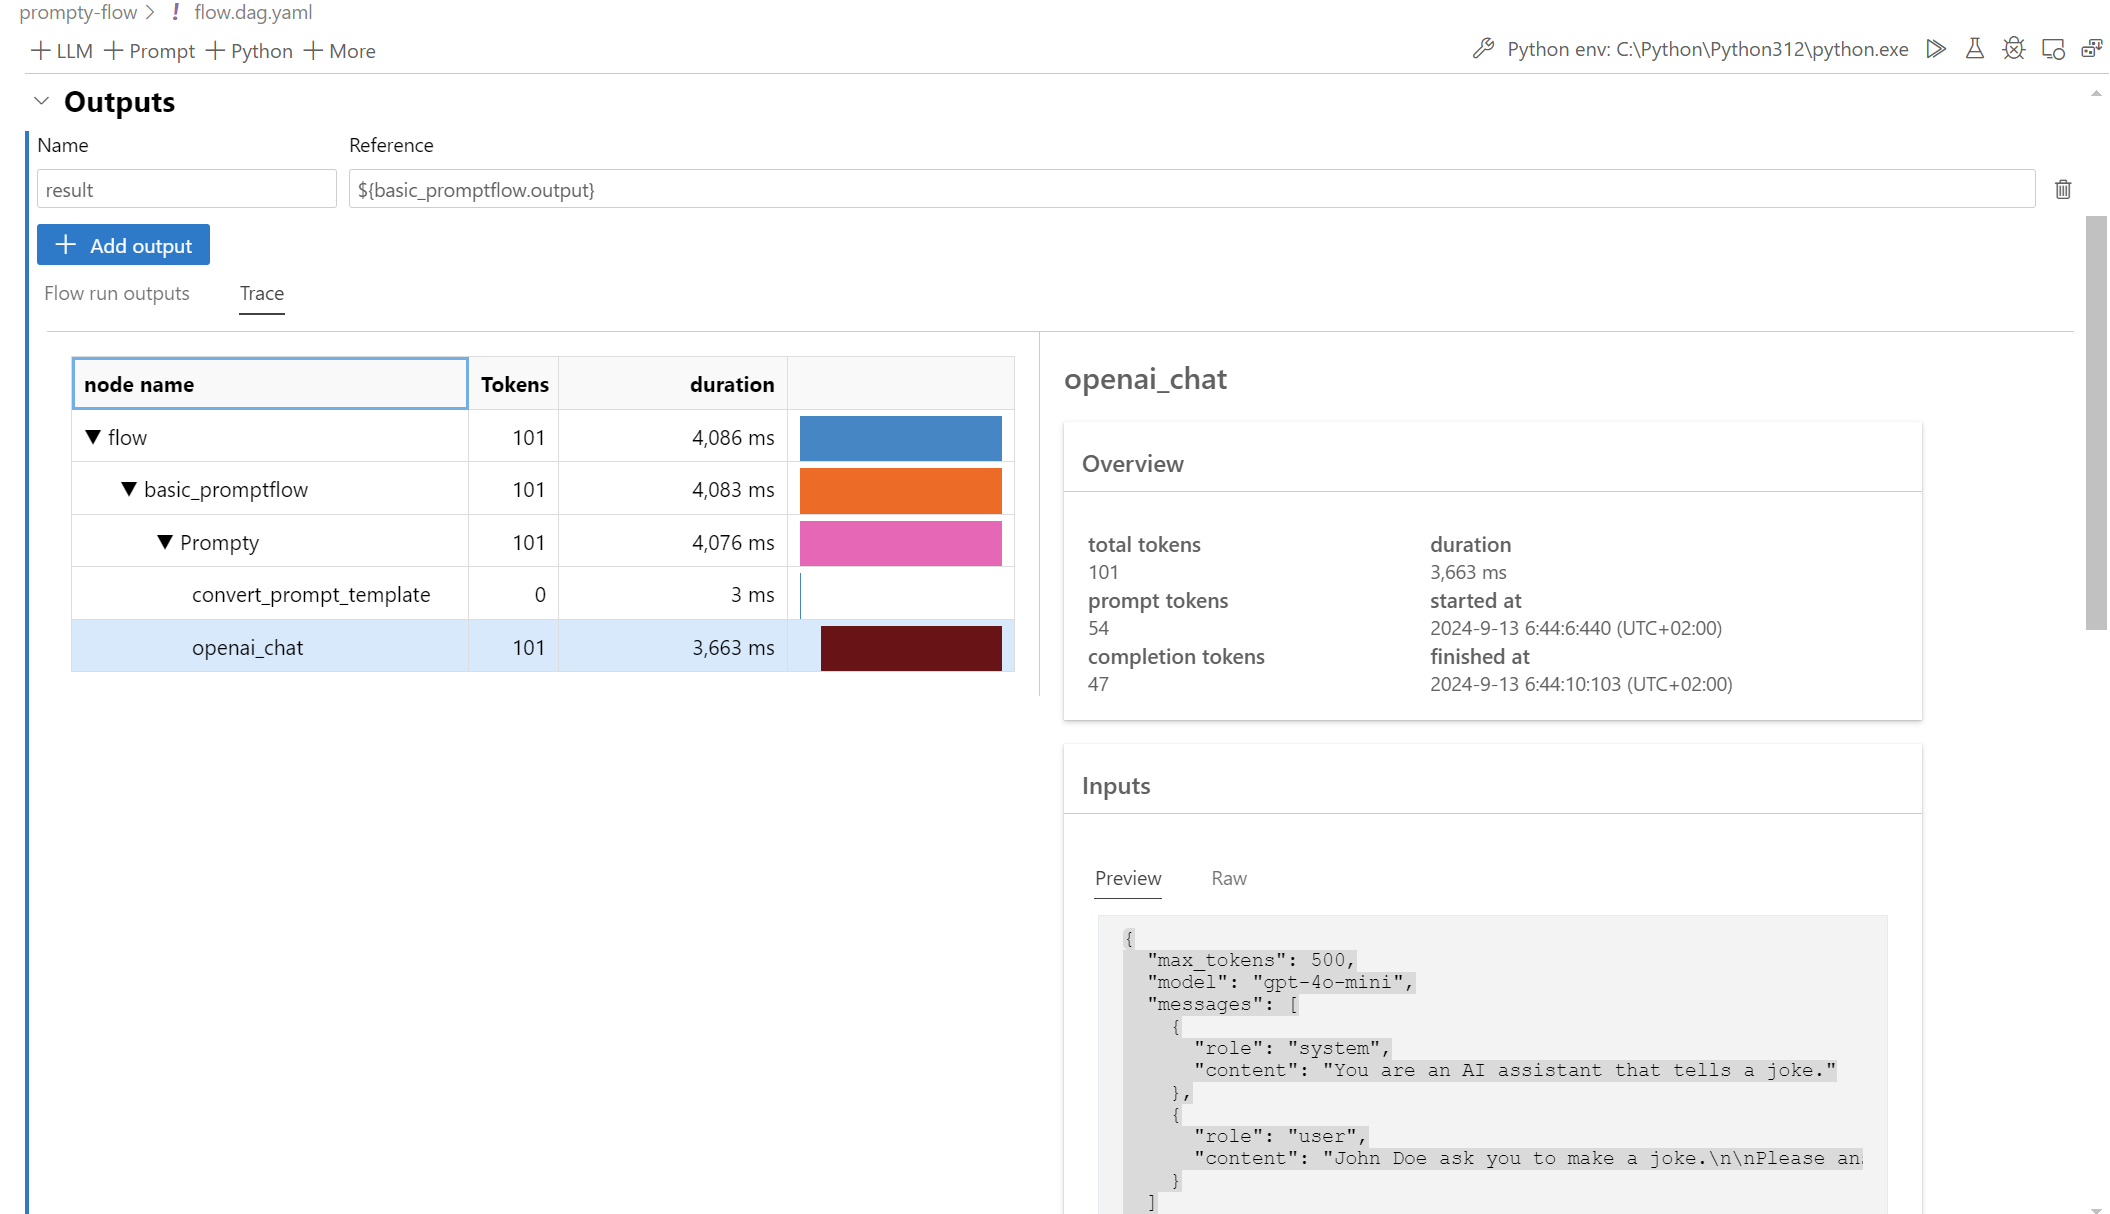
Furthermore, running my Prompt flow in VS Code shows, there are already trace information:
This means that Prompt flow in VS Code enables tracing automatically. But I’m missing this functionality, when I run or debug my basic_promptflow.py file directly:
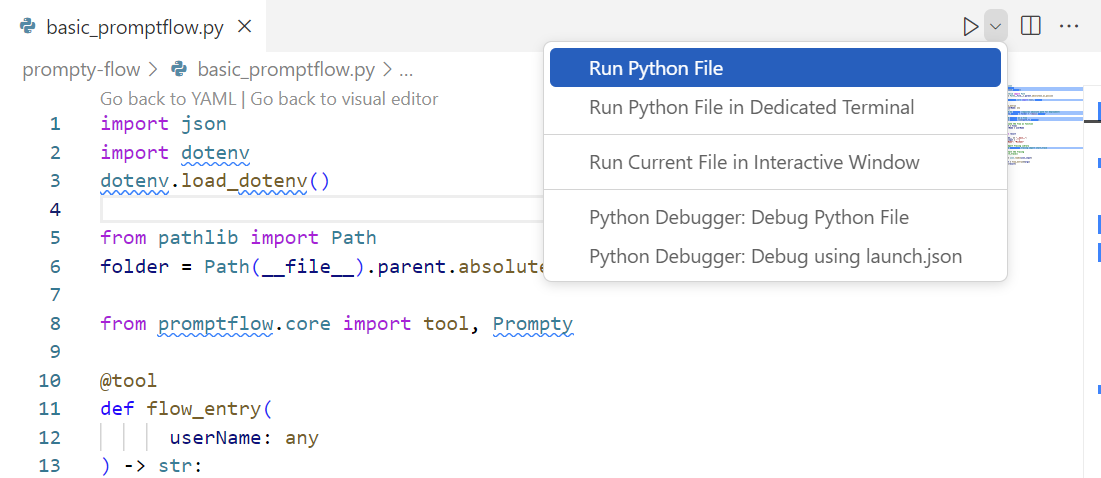
Hmm, as a developer, I want the same insights from trace also when I run my generated Python file directly. And here is the trick…
Enable Tracing directly
As shown, the Prompt flow VS Code extension already uses tracing. Behind the scenes the needed Python libraries are already in place and used from the UI. To have the same comfort, I can install the Python packages and enable tracing in my basic_promptflow.py Python file.
Prerequisites
First, I must install the right Python package promptflow-tracng that helps me to emit traces from my Prompt flow:
pip install promptflow-tracingNext, I install the package promptflow-devkit that introduce trace UI. This helps me to visualize my collected trace information in a user-friendly way:
pip install promptflow-devkitThat’s all for now.
Start Tracing in my Code
Now, I can use the installed Python library directly in my code. For this, I import the package and start the tracing with these lines of code:
# Import Tracing Library
from promptflow.tracing import start_trace

# Start the Tracing
start_trace()
I add the code snippet directly after my program’s entry point. As result, my Prompt flow Python code is this:
import json
import dotenv
dotenv.load_dotenv()

from pathlib import Path
folder = Path(__file__).parent.absolute().as_posix()

from promptflow.core import tool, Prompty

@tool
def flow_entry(
      userName: any
) -> str:
  # path to prompty (requires absolute path for deployment)
  path_to_prompty = folder + "/basic.prompty"

  # load prompty as a flow
  flow = Prompty.load(path_to_prompty)

  # execute the flow as function
  result = flow(
    userName = userName
  )

  return result

if __name__ == "__main__":
  json_input = '''{
  "userName": "Michael"
}'''
  # Import Tracing Library
  from promptflow.tracing import start_trace

  # Start the Tracing
  start_trace()

  args = json.loads(json_input)

  result = flow_entry(**args)
  print(result)
When I run my Python file now in VS Code, the promptflow.tracing module is imported and start_trace() is called. As result, a URL appears in my console:
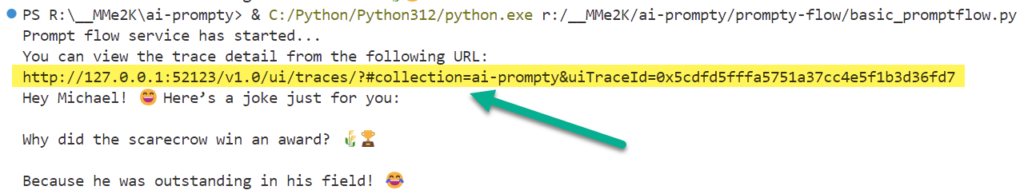
This URL allows me to access the trace user interface from promptflow-devkit.
Trace Viewer
Perfect, after opening the URL in my browser the Trace Viewer appears and gives me all the needed information. Here in the picture, you see, which information are passed to my LLM endpoint:
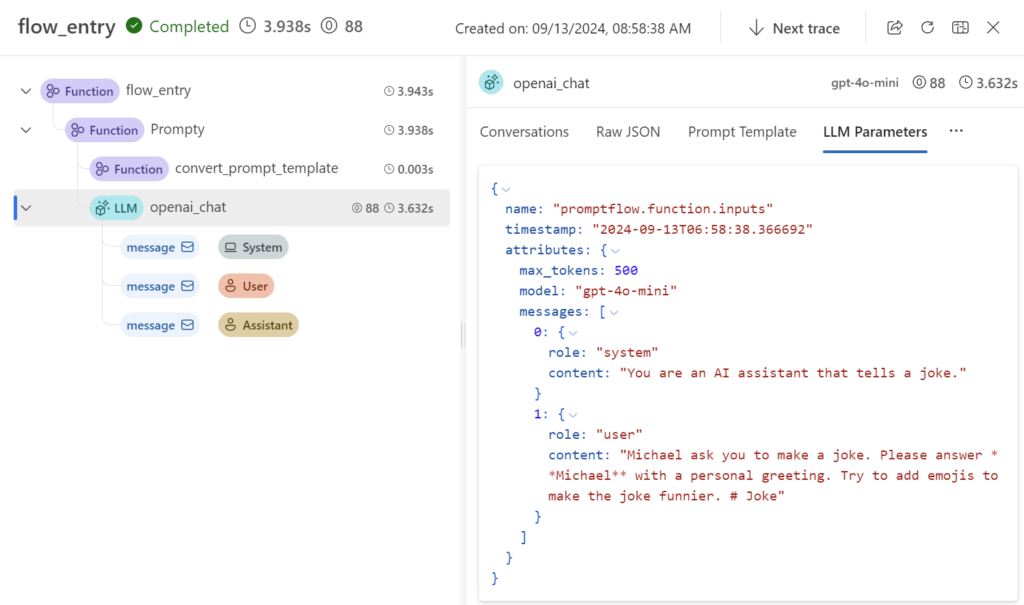
Moreover, you see how I can drill down with the tree of method calls until I’m at the point where API call for my LLM is generated. This improves definitely the development and debugging process for me.
Wait, that’s not all. The Trace Viewer visualizes all my traces that were collected on my local computer over the time:
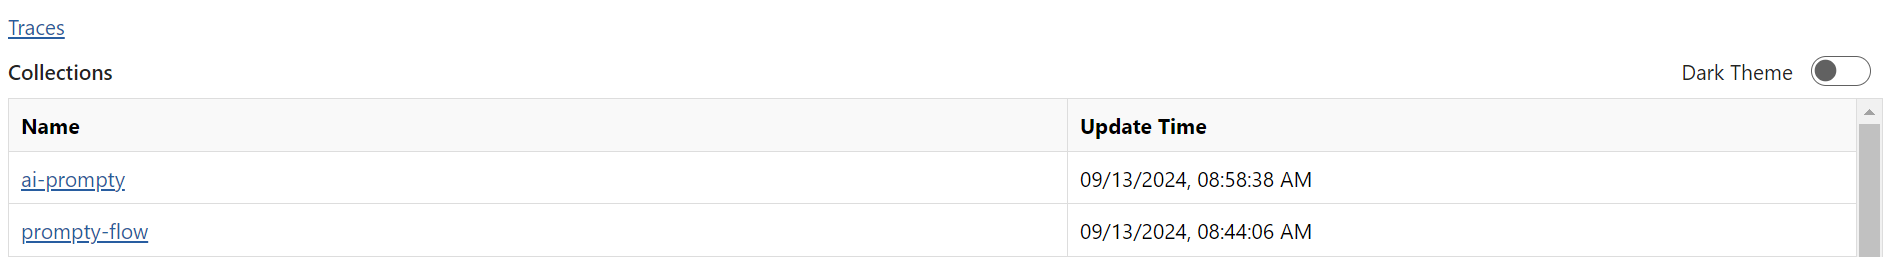
This means, I can navigate to the collections and review older calls as well:
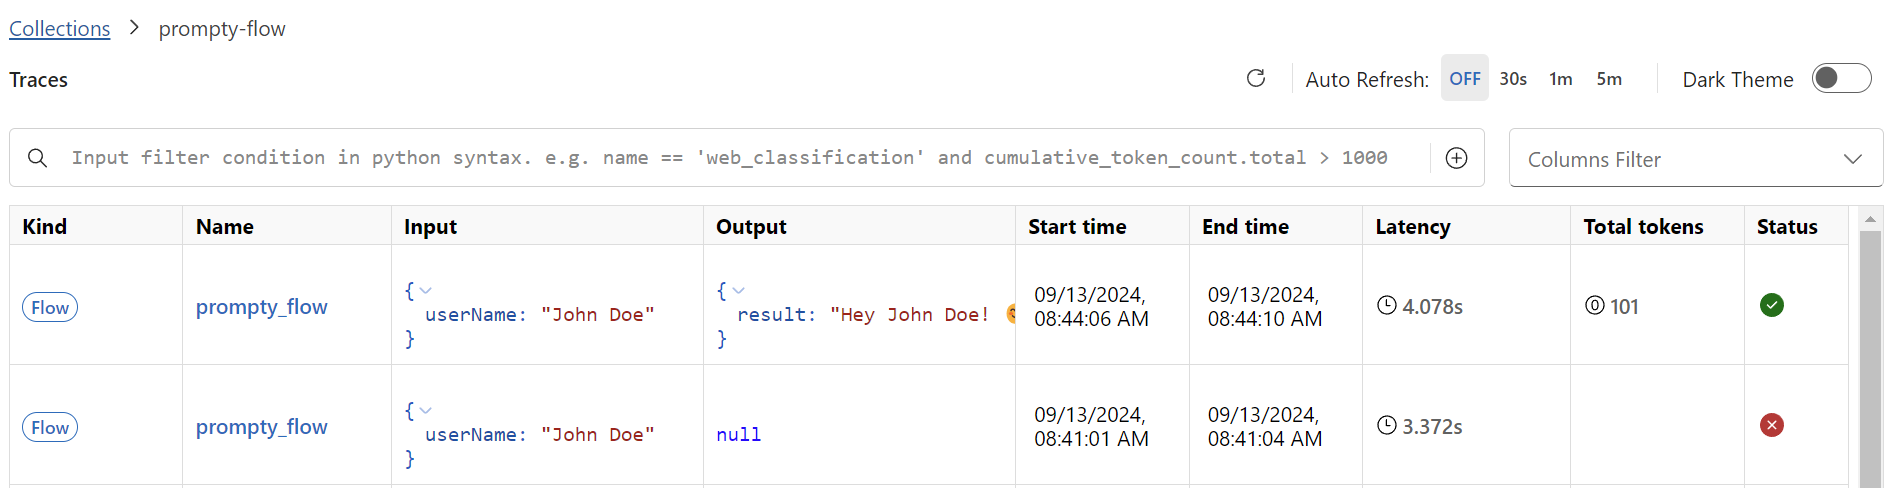
How cool is that? This helps me as a developer a lot. Now I can analyze changes in my AI applications and review the used parameters. Furthermore, I have a chance to switch back to a better working set of parameters to improve my application.
Summary
As a developer, I know about the importance of good debugging and tracing capabilities. Here in my example I demonstrate you how straightforward it is to activate tracing for Prompt flow applications.
I did this by installing necessary Python packages, specifically promptflow-tracing and promptflow-devkit. Furthermore, I included the start_trace() method in my code. Afterwards, my application emitted the traces automatically. Afterwards, I have shown you how I accessed the trace viewer from promptflow-devkit. Here I was able to analyze my current AI application calls as well as review historical trace data.
Tracing and monitoring are crucial components of the development process, particularly when working with advanced technologies like Generative AI and Large Language Models. These tools give me a clear view of what’s happening behind the scenes, helping me debug and refine my applications. In detail, this deeper understanding allows me to ensure that my projects are both powerful and user-friendly.
References:
- Prompt flow tracing: https://microsoft.github.io/promptflow/how-to-guides/tracing/index.html
- Visualize traces: https://microsoft.github.io/promptflow/how-to-guides/tracing/trace-ui.html
- Manage traces: https://microsoft.github.io/promptflow/how-to-guides/tracing/manage.html