Logging in Custom Connector Code
Today, I’m excited to introduce you to a new feature that addresses a common challenge faced by both Citizen Developers and Pro Developers. Yes, you guessed it – we’re delving into the world of creating custom connectors. But I’m not talking about the usual tasks like setting up requests, responses, or authentication. No, the real test comes when we venture into coding within our custom connectors.
See more here at Microsoft Docs: Write code in my custom connector.
Moreover, there’s a significant pain point that emerges during the development of my custom connector’s code. I often find it difficult to analyze problems effectively – it’s like navigating through a haze. In plain English, debugging my code becomes a difficult endeavor. But let me tell you, there’s a reason I’m writing this blog post. The silver lining is that I have discovered the power of logging in my custom connector’s code!
Custom Connector Example
Let me guide you to a small example. Here is my custom connector in Swagger 2.0 definition. You see, I use a simple route "info":
swagger: '2.0'
info:
  title: MyConnector
  description: ''
  version: '1.0'
host: api.contoso.com
basePath: /
schemes:
  - https
consumes: []
produces: []
paths:
  /info:
    get:
      responses:
        '200':
          description: Success
          schema: {}
      summary: Info
      description: Info
      operationId: info
      parameters: []
definitions: {}
parameters: {}
responses: {}
securityDefinitions: {}
security: []
tags: []
Furthermore, I navigate to the section Code in my Custom Connector designer:

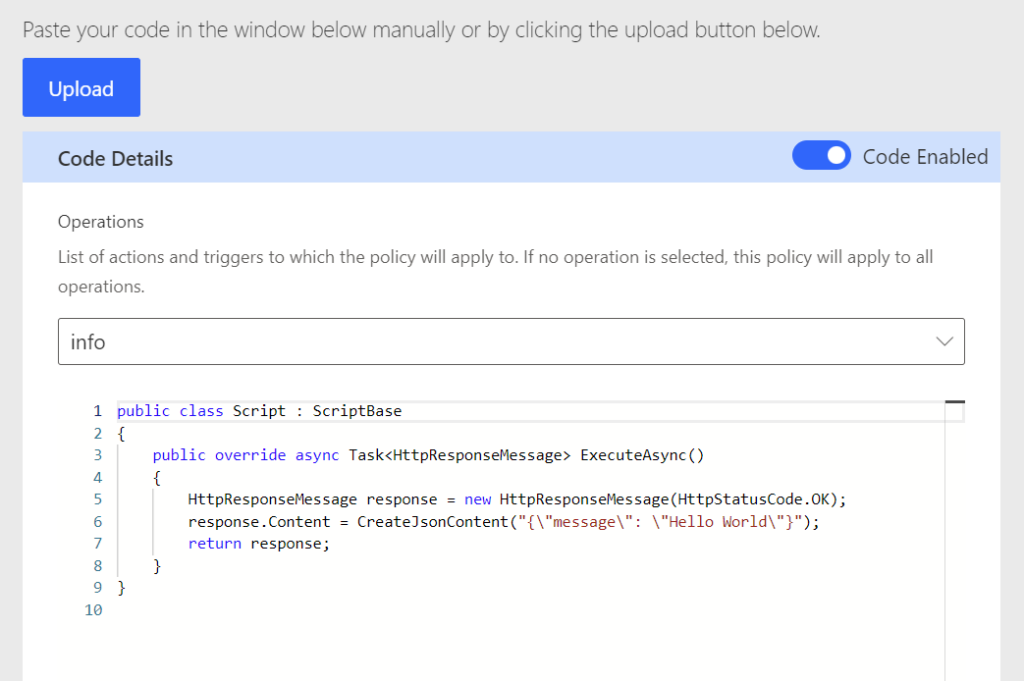
Here I enable the sample code in my Custom Connector designer:
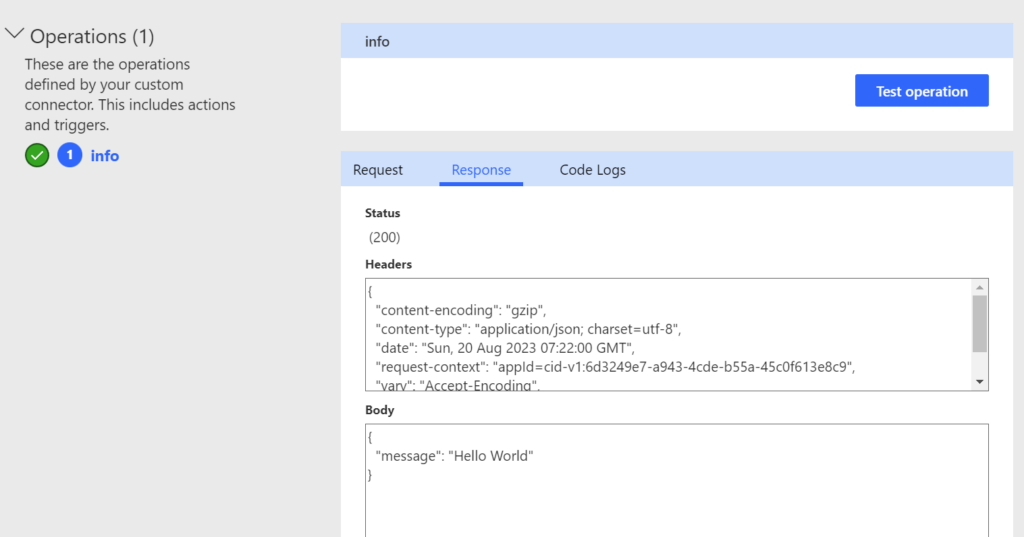
As result, my connector returns "Hello World":

Code Logs
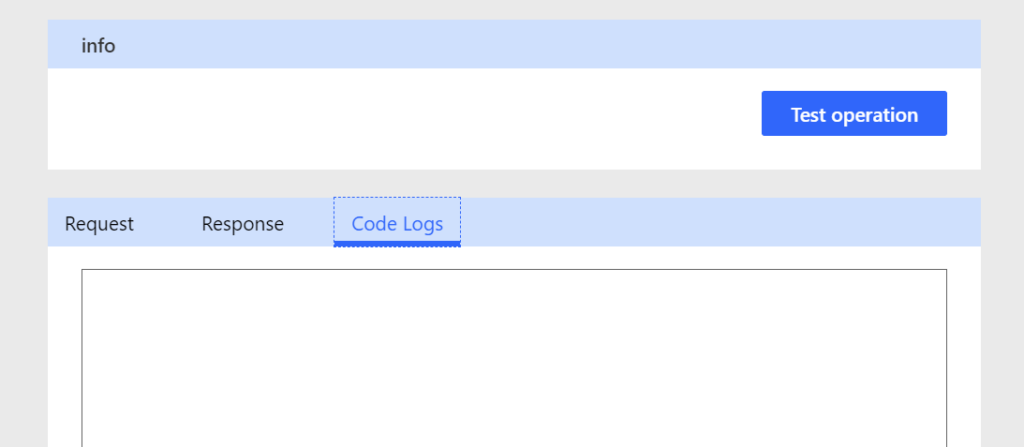
… and yes, this is where I stumbled upon it recently. There’s a fresh output window here called “Code Logs”. In other words, I can add logging to my custom connector code and the content will appear here:

But what is needed to do this? Once again, I’ll have a second look to Microsoft docs for “Definition of supporting classes and interfaces“. And here is, what I need:
public abstract class ScriptBase
{
    // Context object
    public IScriptContext Context { get; }

    // ...
}

public interface IScriptContext
{
    // ...

    // Logger instance
    ILogger Logger { get; }

    // ...
}
Perfect. You see, I can use property Logger from class property Context in ScriptBase for the logging in my custom connector. Let me wrap this is a short example.
Logging in Custom Connector Code
As mentioned, the property Logger from Context implements ILogger. This means, I can log these types:
- Traces
- Information
- Warnings
- Errors
- Critical
This is a lot. I’ll give you a short example, how you can use the Logger in your custom connector code:
public class Script : ScriptBase
{
    public override async Task<HttpResponseMessage> ExecuteAsync()
    {
        HttpResponseMessage response = new HttpResponseMessage(HttpStatusCode.OK);
        Context.Logger.LogTrace("Script started");

        // Logging an information
        Context.Logger.LogInformation($"Operation [{Context.OperationId}] {Context.Request.Method} {Context.Request.RequestUri} was called.");

        // Logging errors
        try
        {
            throw new Exception("This is an error.");
        }
        catch (Exception ex)
        {
            Context.Logger.LogError($"An error occurred: {ex.Message}");
            Context.Logger.LogCritical("This is critical");
        }

        // Logging warnings
        if (true)
        {
            Context.Logger.LogWarning("A warning message here.");
        }

        response.Content = CreateJsonContent("{\"message\": \"Hello World\"}");
        return response;
    }
}
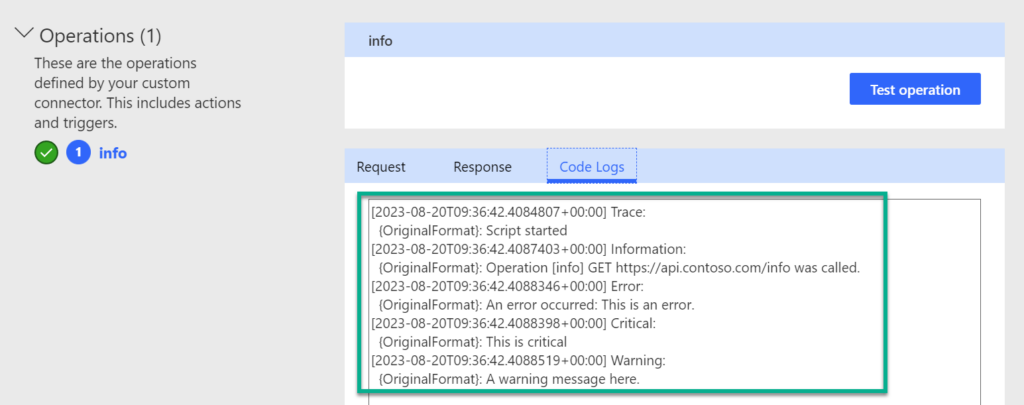
The result of my custom connector code after testing is this:

You see, the all my messages from custom connector code appear now in the Code Logs window.
Summary
To sum up my blog post, logging in custom connector code is now supported. This is in my opinion definitely an absolutely fantastic addition. Thanks to this new capability, I can perform complicated transformations in my custom connector code and use logging to effectively troubleshoot problems as they arise.
