Analyse your Solution Dependencies in Dataverse
Did you ever try to remove a managed solution from your TEST or PROD environment? Yes? Then you know how to discover solution dependencies in Dataverse. In other words, you are familiar with the challenge of figuring out which solution contains dependencies on another solution to unlock the uninstall process in productive Dataverse environments.
And yes, this can be a cumbersome job to collect all these solution dependencies. On the other hand, you get some help from Dataverse. To do this – navigate to your solution and click on “Show Dependencies”:
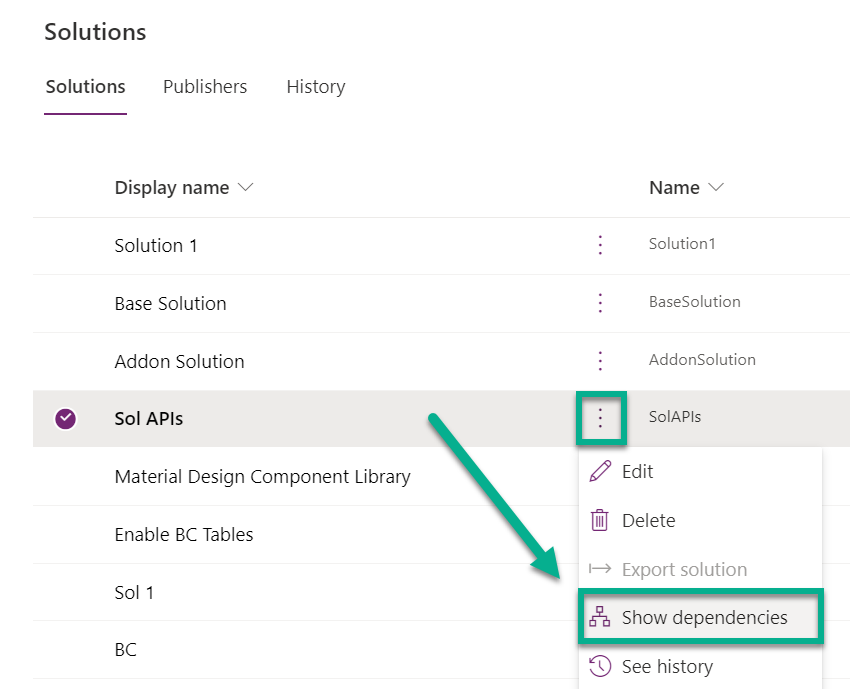
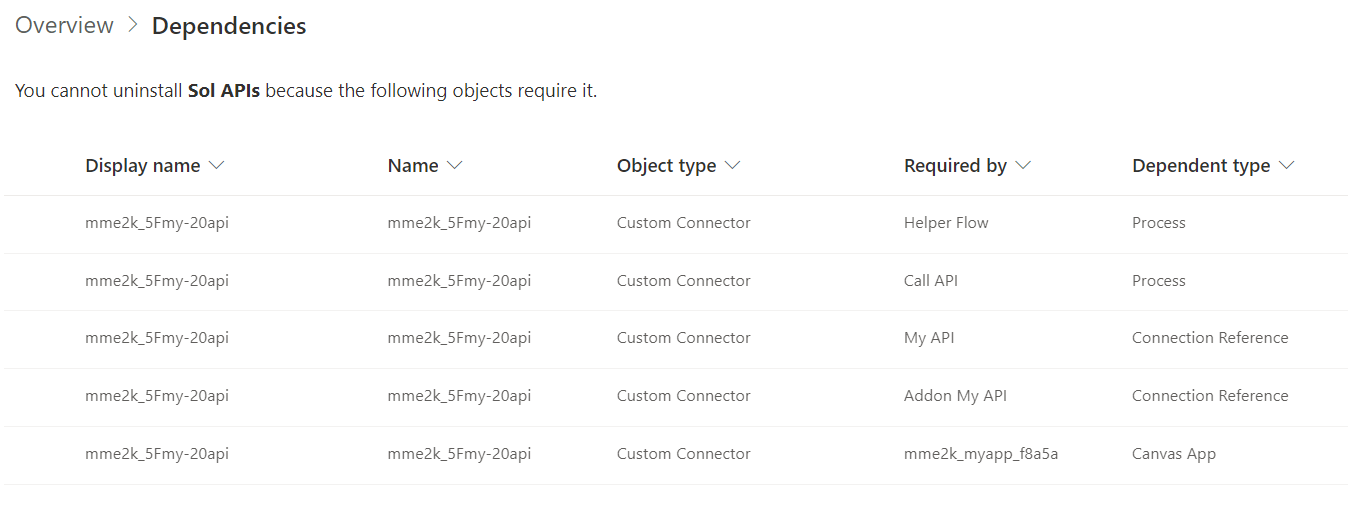
After I perform this action, a view opens showing me the current dependencies of my Dataverse solution:

A step in the right direction. I see a list of all components that have dependencies on components on my solution. Now it is up to me to find these components, check for other dependencies and uninstall all these solutions first. Afterwards, I can remove or replace my initial solution.
What if I would see, which solutions have related dependencies to my initial solution? What if I would have a Diagram of my environment. Hey, I’m a Pro-Developer – let’s change this and build a graph in my VSCode extension “PowerApps Helper”!
Power Apps Helper
I originally developed PowerApps Helper to download and extract the source code of Canvas Apps and Dataverse solutions. But now it’s more than a download and upload tool for me.
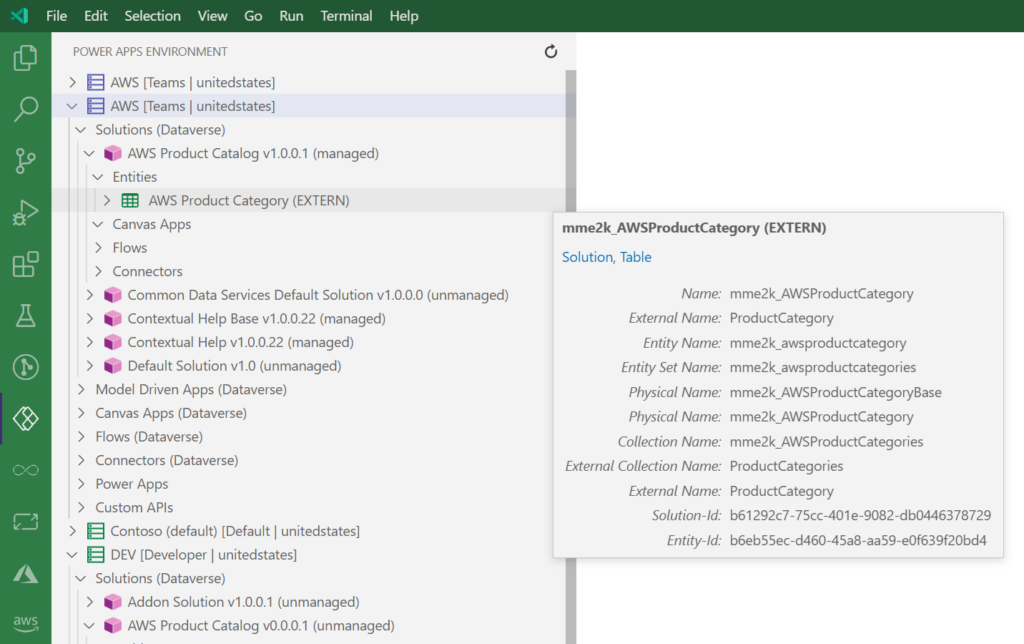
My PowerApps Helper VSCode extension helps me to get more insights about Power Apps and Dataverse. One of my most used features is the environment tree. For that reason, I have added tooltips including useful links in order to access my tables and canvas apps also in Dataverse for Teams:
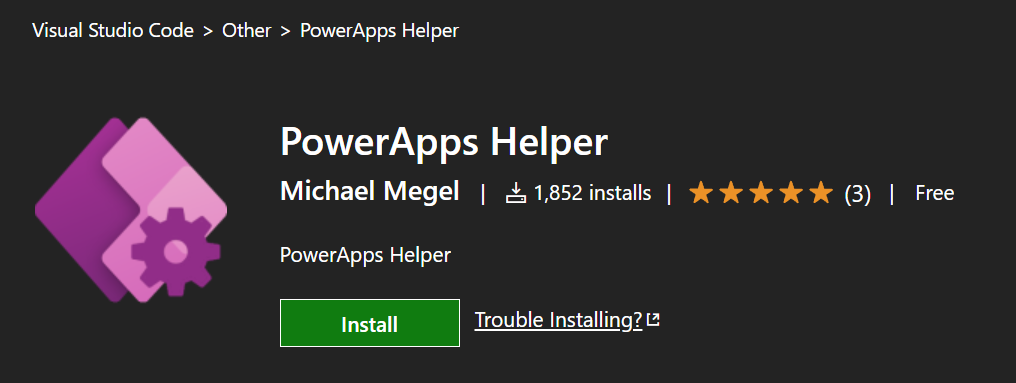
As mentioned previously, my extension is open source and available for everyone. You can open the Visual Studio Marketplace and install my extension in your Visual Studio Code.
Rendering a Diagram
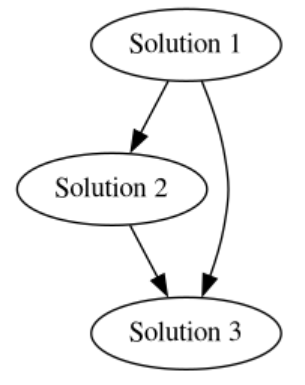
I use Graphviz to render my diagram in PowerApps Helper. Graphviz is an open source graph visualization software. In other words, I can define a simple graph like this:
A [label="Solution 1"]
B [label="Solution 2"]
C [label="Solution 3"]
A -> B
B -> C
A -> C
…and use the open source library to render that diagram for me:
Important:
You must install Graphviz as rendering engine on your local computer, when you want to use Visualize Dataverse Dependencies in Power Apps Helper. The download of graphviz is here: https://graphviz.org/download/
Optionally, you can also set up this tool as a micro API and configure the URL in PowerApps Helper. Details will follow in another blog post.
What’s new inPower Apps Helper?
I have added a new capability to visualize my Dataverse environments. Especially, when I struggle with my solution dependencies.
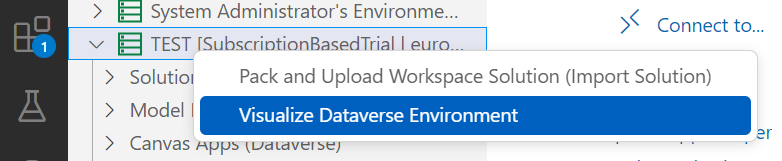
You find this new action either in the VSCode command palette: [Ctrl+Shift+P] and “Power Apps: Visualize Dataverse Environment” or as “Click-Action” in the Dataverse Environment Tree:
PowerApps helper collect all information about solutions and its dependencies after selecting an environment. Well, I have to wait a short while, but this depends on the amount of solutions in the selected environment.
As result, I see my environment information some seconds later in an overview:
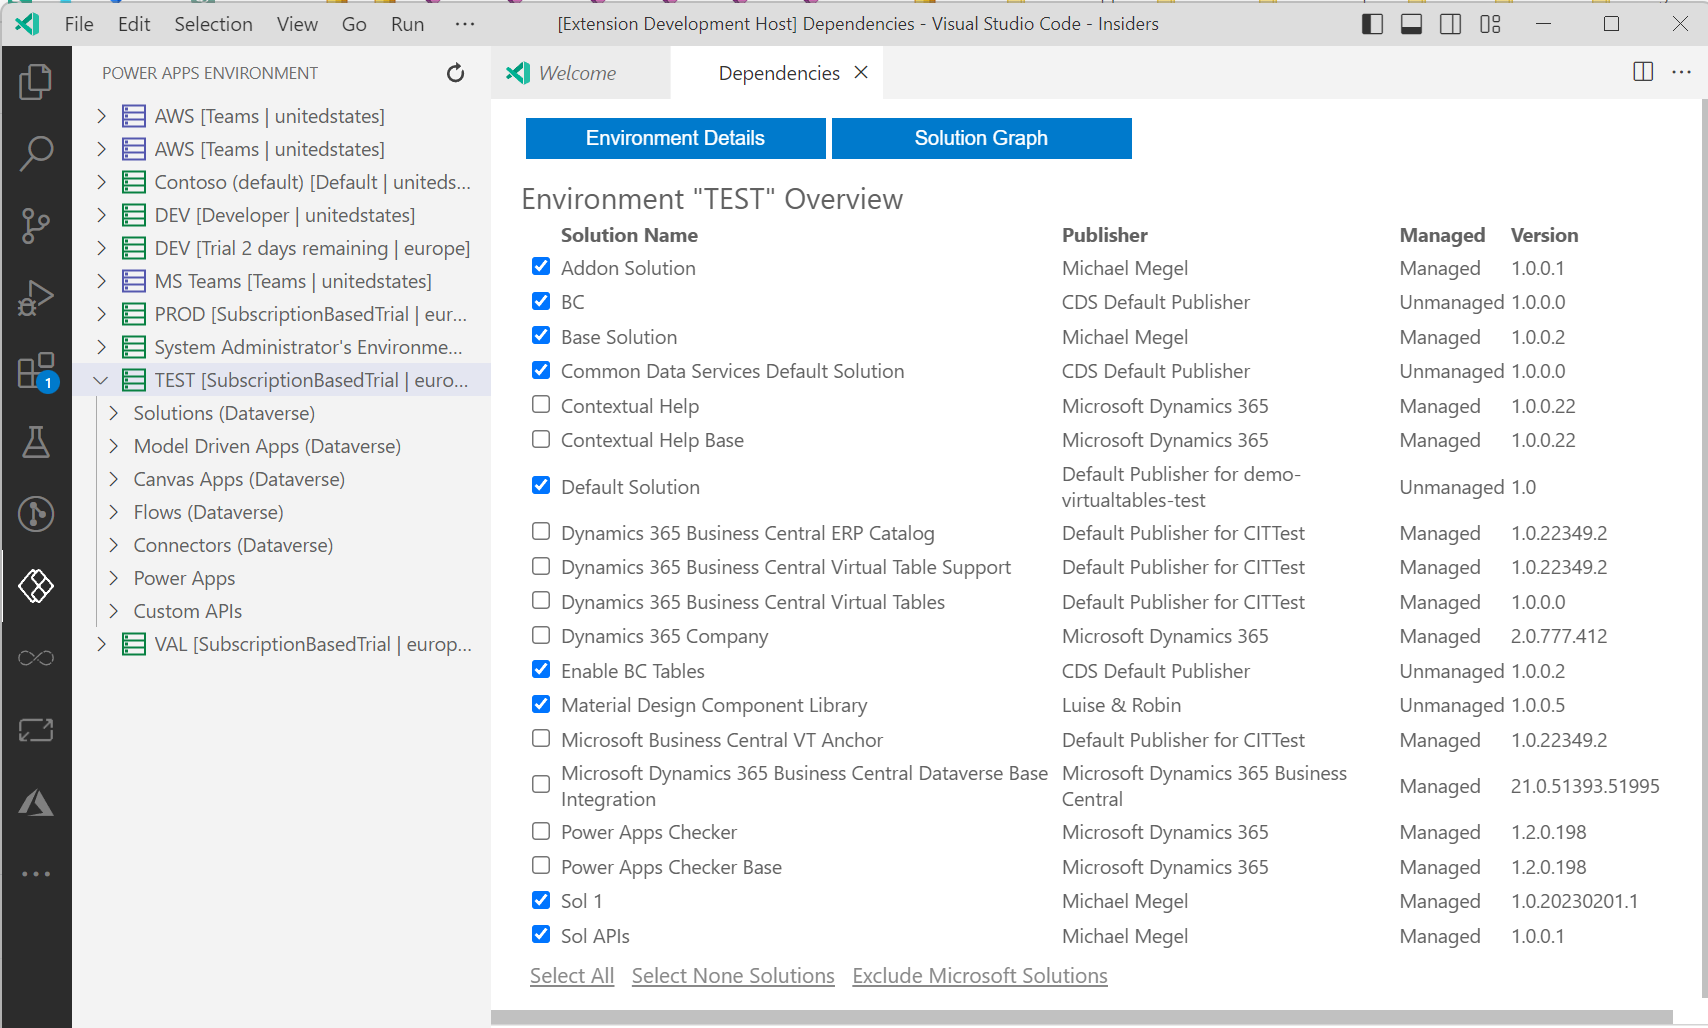
Furthermore, you can select and unselect solutions for the visualization. I have preselected all non Microsoft solutions, to minimize a little bit my solution graph for my environment.
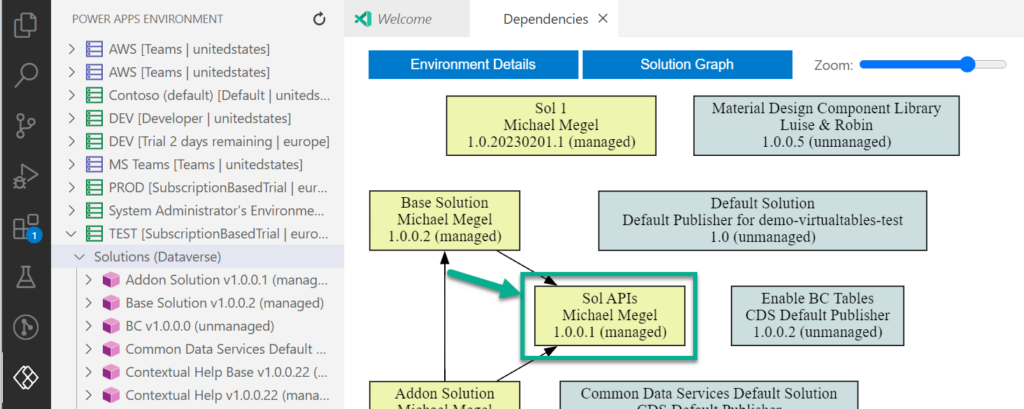
Here you see the result, when I clicked on my button “Solution Graph”:
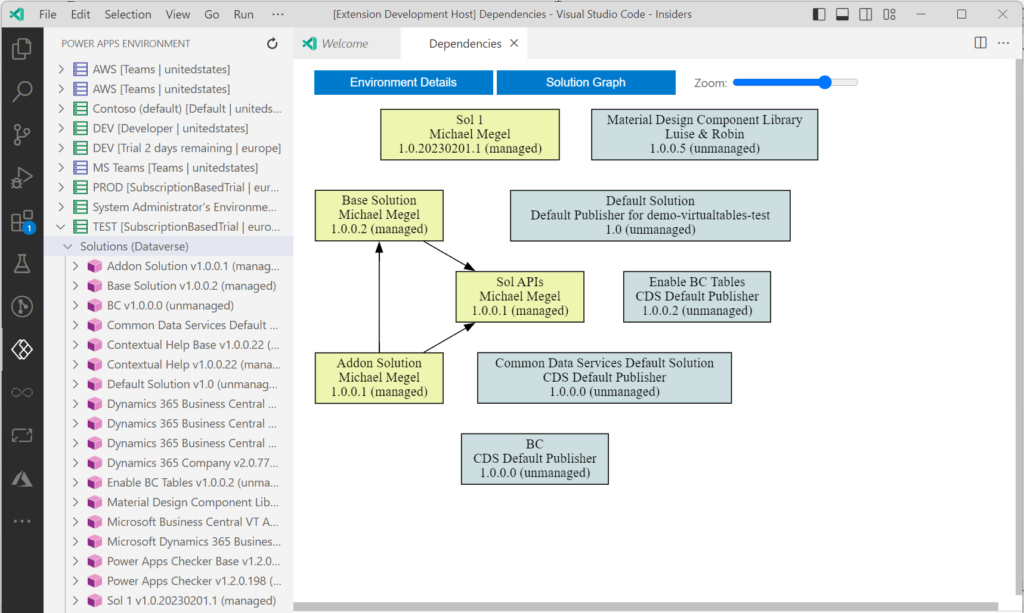
The “Zoom” helps a little bit to reduce the graph in larger environments. This overview provide top level information about the solution dependencies.
Finally, when I can click also on solutions in my Environment Graph. I did this for “Sol APIs”:
As result, another graph is generated and rendered:
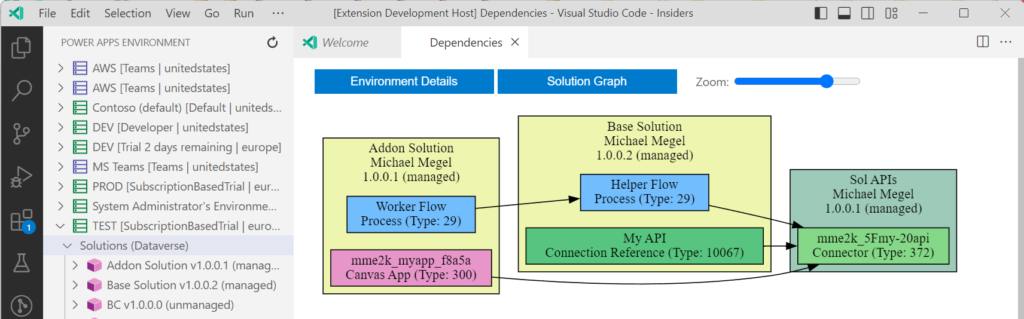
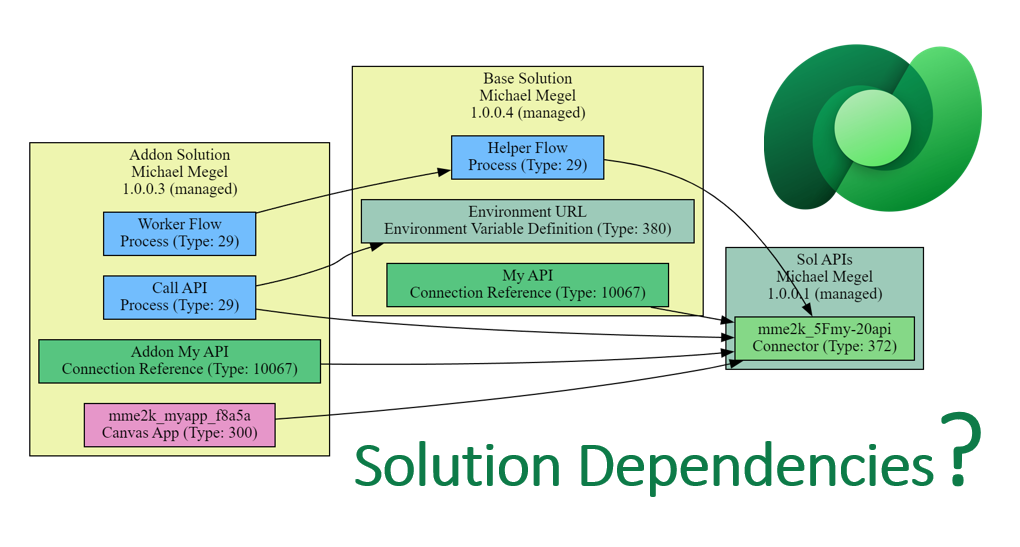
As you can see, this view provide a lot more information about the solution dependencies based on my selected solution. There are all components shown, which have dependencies to any of my component in my selected solution “Sol APIs”.
I see here in the example that my Power Automated Flows from“Addon Solution” and “Base Solution” are using my custom connector in “Sol APIs”. Furthermore, my canvas app in “Addon Solution” uses also my custom connector in “Sol APIs”.
LevelUp Analyzing my Solution Dependencies in Dataverse
The initial example was quite simple. Now I want to show you a more advanced scenario. Therefore, I made some adjustments in my DEV environment. After rollout of my solutions into my TEST environment the picture changes a little bit.
On my solution “Sol API” are now these dependencies:
In contrast, my solution “Addon” have no information about any dependencies for me:
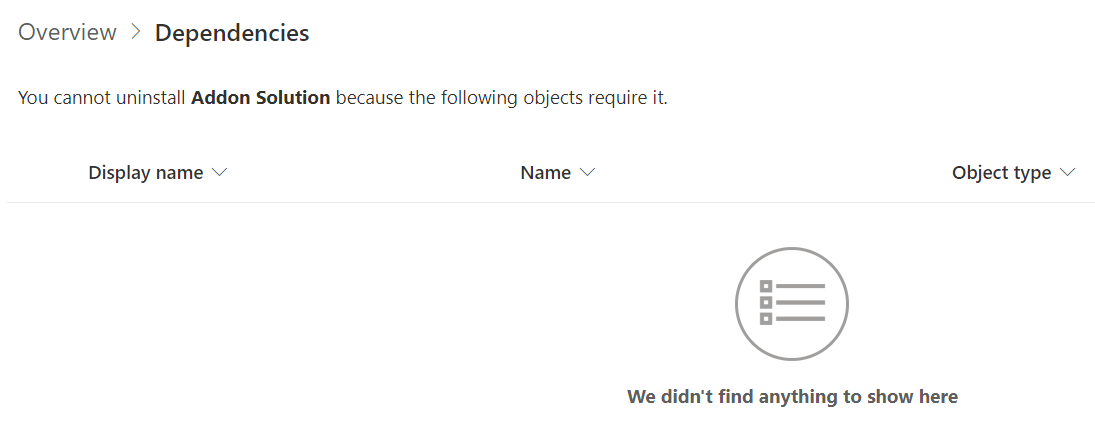
And yes, this is also right. This is because my solution “Addon” is the topmost solution in my example. In other words, I can uninstall solution “Addon” without problems. But I have no information about this fact in Dataverse.
My VSCode environment diagram has also changed and show some interesting details. Like before, my solution “Addon” is a topmost solution, but have now 3 dependencies. It is shown in a very prominent position in my diagram:
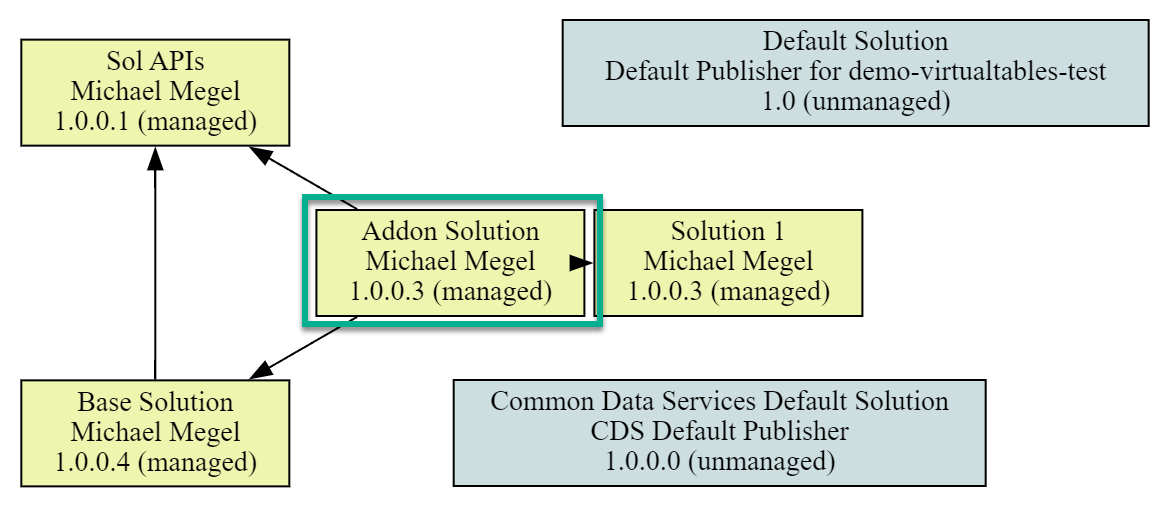
I get more detail by clicking direct on my solution “Addon”. I think that’s what I wanted to know when I talk about dependencies:
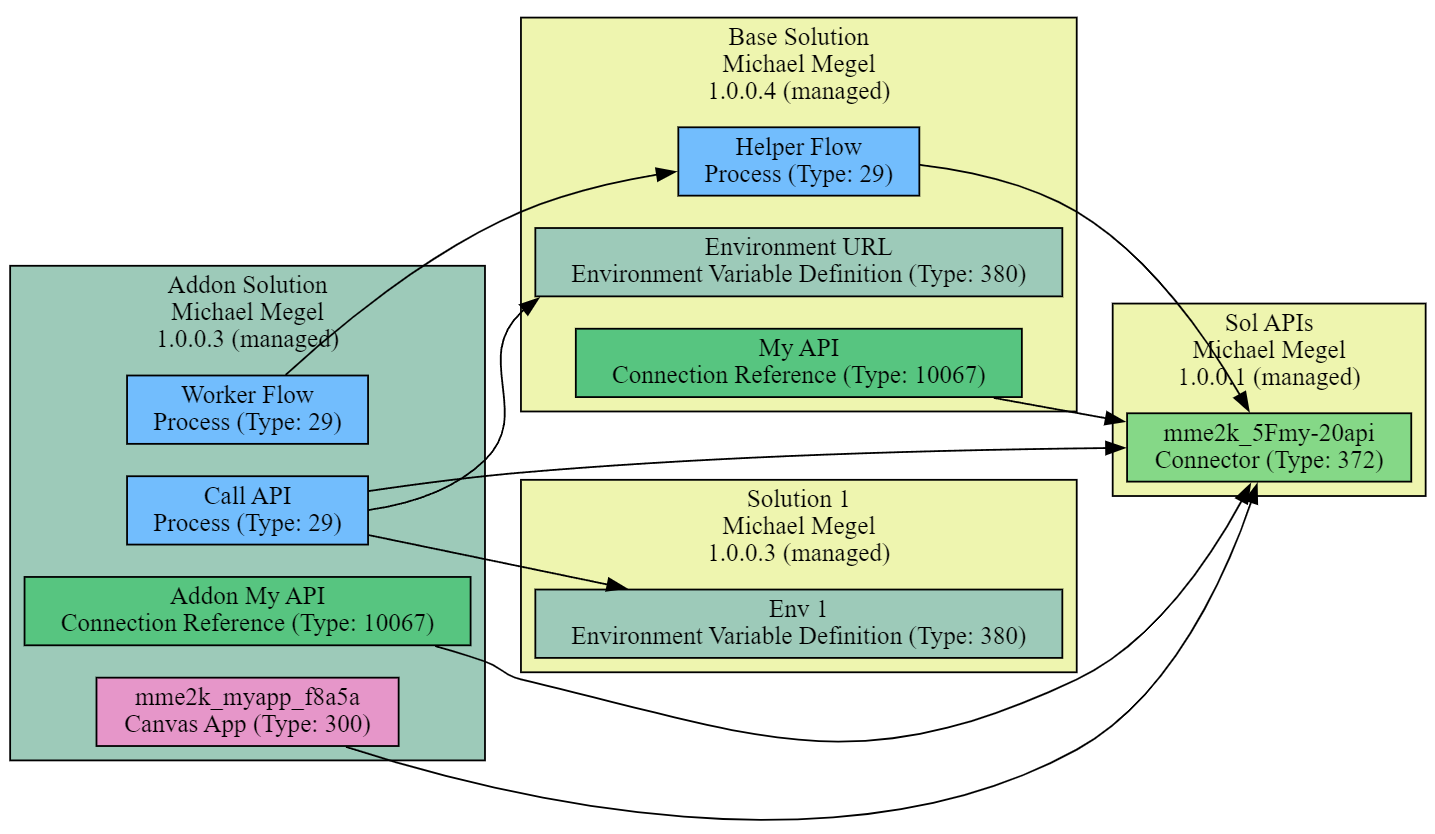
I see now more details, my Canvas App from “Addon” uses the API from “Sol APIs“. Furthermore, my Power Automate Flow “Call API” also uses my custom connector. Also, I see that an environment variable from “Solution 1” needs from Power Automate Flow “Call API“.
These are much more information in contrast to the lists in Dataverse…
Summary
Dependencies between solutions in Dataverse are often complex and hard to discover. You get this information as a list from Dataverse and you can analyize these dependency information.
A better way for me is to use my Visual Studio Code extension: “PowerApps Helper”. The new functionality help me to analyze my Dataverse TEST and PROD environments. Furthermore, the diagram give me a much better understanding of my solution architecture.
Finally, I also see that this little new feature makes me hungry for more information. For example, what about my components in my DEV environment? How can I analyze these dependencies? I’ll have to look into that…