Monitoring Telemetry from Azure Data Studio
Recently, I realized that there is a very simple way to prepare and share telemetry reports. This are Jupyter Notebooks.
A Jupyter notebook is ideal for combining documentation texts and telemetry queries. This means that my explanations and recommendations for action are part of my telemetry reports.
I like this possibility. This helps us at COSMO CONSULT to create prepared reports for monitoring and analysis of Microsoft Dynamics 365 Business Central in a simple way.
Prerequisites
First, I have to install Azure Data Studio. For this I prefer to use Chocolatey. Therefor my command line is:
choco install azure-data-studioSecondly, I need Python. To be honest, this requirement is already fulfilled in my environment. I use Python for Azure Functions, data analysis etc.
Finally, I have to install the extension Kqlmagic. This allows me to run Jupyter Notebooks within the Kusto Query Language.
For this, I use the python package installer pip to install KQlmagic:
pip install Kqlmagic --no-cache-dir --upgradeApplication Insights
You can create an Application Insights component in the Azure Portal, using the ACL or in the PowerShell. My example show the PowerShell command which uses the module Az.ApplicationInsights:
C:/> $ai = New-AzApplicationInsights -ResourceGroupName "ai-test" -Name "ai-test" -Location 'West Europe'
The created Application Insights component contains the Instrumentation Key and App–Id but not the API-Key for my KQL-Query:
C:/> $ai
Id                 : /subscriptions/12341234-1234-1234-1234-123412341234/resourceGroups/ai-test/providers/microsoft.insights/components/ai-tes
t
ResourceGroupName  : ai-test
Name               : ai-test
Kind               : web
Location           : westeurope
Type               : microsoft.insights/components
AppId              : 1e558f15-70bc-4565-861b-34212e82015c
ApplicationType    : web
Tags               : {}
CreationDate       : 17.09.2020 07:31:56
FlowType           :
HockeyAppId        :
HockeyAppToken     :
InstrumentationKey : 583164cb-6643-406d-b2f9-50f5a9a0e26c
ProvisioningState  : Succeeded
RequestSource      : AzurePowerShell
SamplingPercentage :
TenantId           : 12341234-1234-1234-1234-123412341234
As result, I use the “New-AzApplicationInsightsApiKey” to create the required API-Key as follows:
New-AzApplicationInsightsApiKey -ApplicationInsightsComponent $ai -Permissions ReadTelemetry -Description "Test"As you can see, the output contains now the needed API-Key:
ApiKey      : 7tz6rgu0cn1twyyznlwzzcsf5ui2e7tkupk4hwzk
CreatedDate : Thu, 17 Sep 2020 07:33:31 GMT
Id          : ce04cff5-9270-4bb7-b25b-2e94f45a2ef5
Permissions : {ReadTelemetry}
Description : Test
My First Jupyter Notebook
I create a new Notebook by opening “File” and “New Notebook” in my Azure Data Studio.
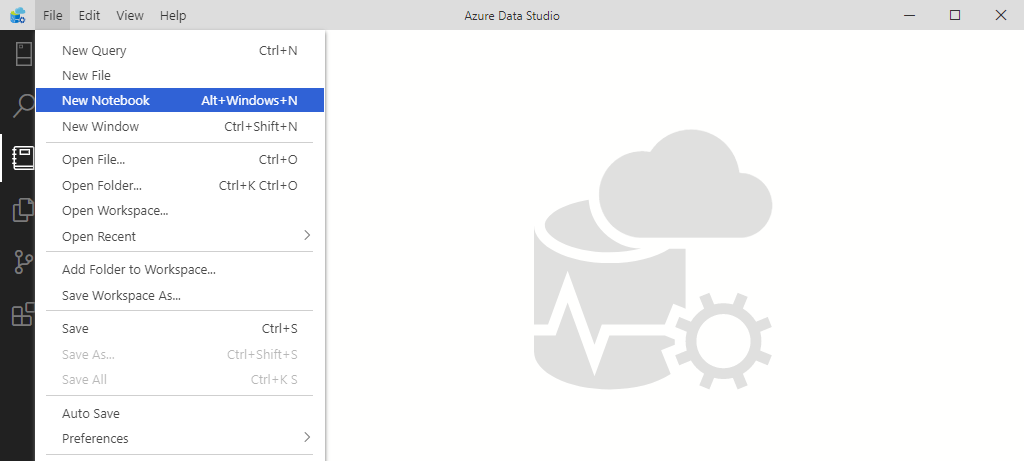
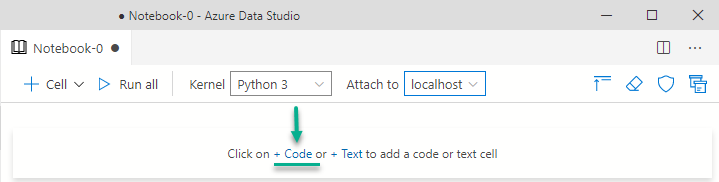
Afterwards I select Python 3 as Kernel:

… and finally I’m ready to run my first KQL-Query. Therefore I add a Code-Block into my notebook:
I reload the Kqlmagic extension in my Code-Block and connect KQL to my Application Insights datasource by configuring the App-Id and App-Key:
# load the KQLmagic module
%reload_ext Kqlmagic

# Connect to the Application Insights API
%kql appinsights://appid='<add app id from the Application Insights portal>';appkey='<add API key from the Application Insights portal>'
This is because, Kqlmagic must have read access to my Application Insights component as it’s data source.
My First Query
Let’s grab a prepared query from Azure Application Insights and insert it into the created jupyter notebook.
Open the Application Insights component in your Azure Portal and navigate to “Sessions”. To access the KQL-Query select the button “Open query in Log View”:
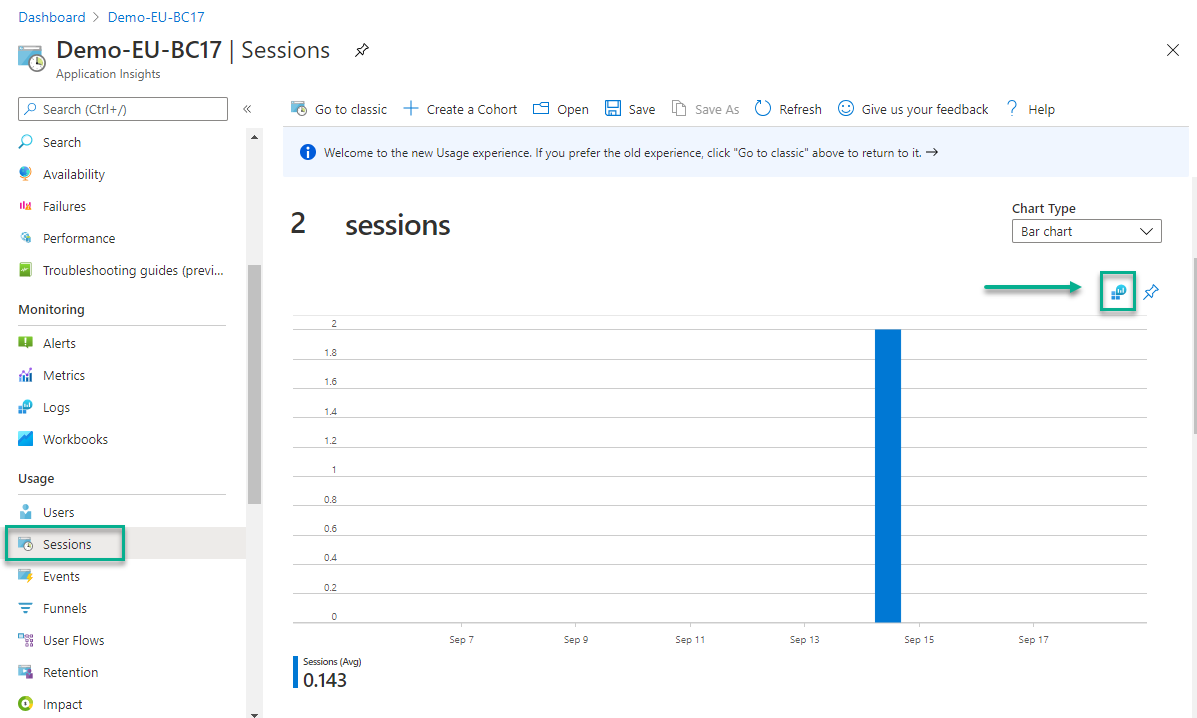
As result the Log Viewer opens with the KQL query:
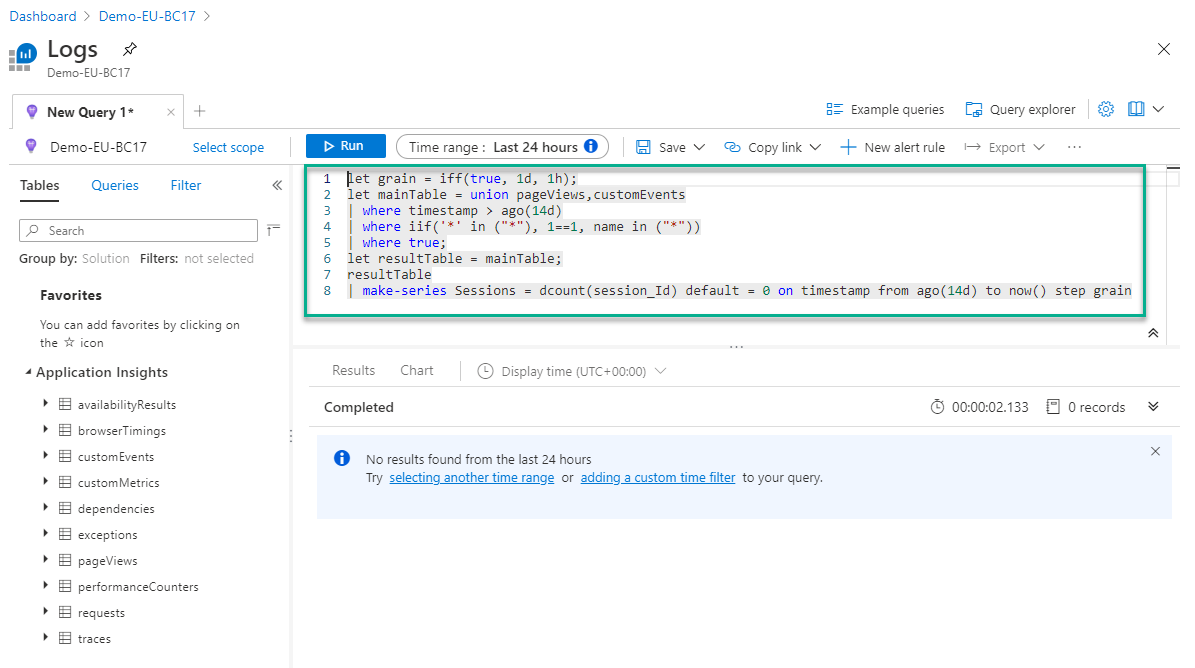
If you wish, you can use the Log Viewer in Azure Portal to complete and optimize your KQL-Query. Within the Jupyter notebook, you must add the command “%%kql” at the beginning of the code block for Kqlmagic to interpret the query in the right way:
%%kql

let grain = iff(true, 1d, 1h);
let mainTable = union pageViews,customEvents
| where timestamp > ago(14d)
| where iif('*' in ("*"), 1==1, name in ("*"))
| where true;
let resultTable = mainTable;
resultTable
| make-series Sessions = dcount(session_Id) default = 0 on timestamp from ago(14d) to now() step grain
After the first run you will notice that the query result does not look like your session overview in Azure Application Insights:
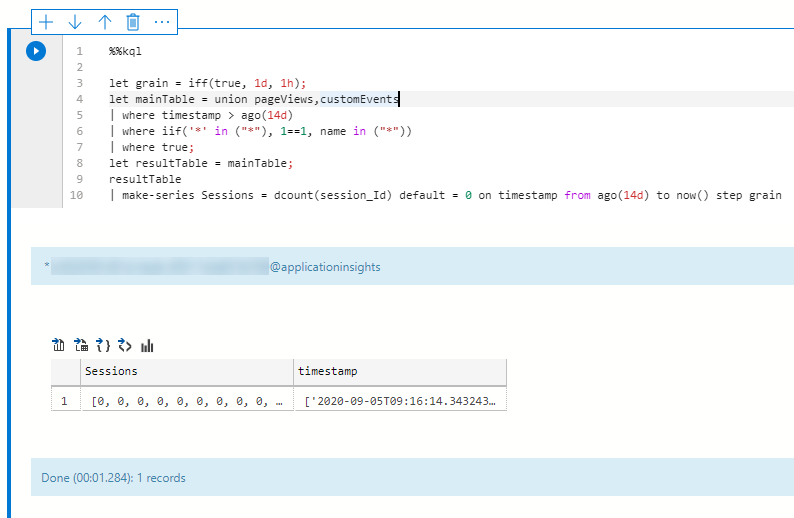
What went wrong? Nothing – the data aggregated to “sessions” and “timestamps” is present, but has to be transformed for rendering.
Firstly, I extend (ms-expand) the multi-value array “Sessions” and “timestamp”. Secondly I project the columns into a data format that is accepted by the rendering. Therefore, my added code is:
| mv-expand Sessions, timestamp
| project  Sessions = toint(Sessions), timestamp = todatetime(timestamp)
| render timechart with (xcolumn = timestamp, ycolumns=Sessions, title = "Sessions per week", xtitle = "Day")
And finally my time chart of my sessions is rendered as expected:

Well, only two sessions – but that is the life cycle of a freshly created demo system. 🙂
Start Troubleshooting Business Central
After our initial warmup with Azure Data Studio and Application Insights you might want to start with real life challenges. For this, Microsoft has provided example Jupyter Notebooks at Github:
BC-Tech AppInsights Trouble Shooting Guides
All you have to do is follow this instructions and:
- Clone the repository.
- Insert your Application Insights App-Id and App-Key
- Modify the filters like Tenant Id and Environment Name of your customer.
- Finally run the Report / Queries
Is that simply – Yes, it is!
Conclusion
A Jupyter Notebook is in my opinion a great way to combine KQL Queries with documentation and recommendations. This makes it easy to share reporting and monitoring functions for telemetry with less technical people.
Furthermore, any required technical component can be generated automatically. In other words, you can also automate the creation of such as Application Insights and it’s API-Key.
Finally, Jupyter Notebooks are also JSON files. This means changing the App-Id and the App-Key with PowerShell is easy. As result, you get a preconfigured report.
What’s about VS-Code an Jupyter Notebooks?
This is no big surprise. You can also run your Jupyter notebooks in VS code. I discovered this fact while writing my blog post:
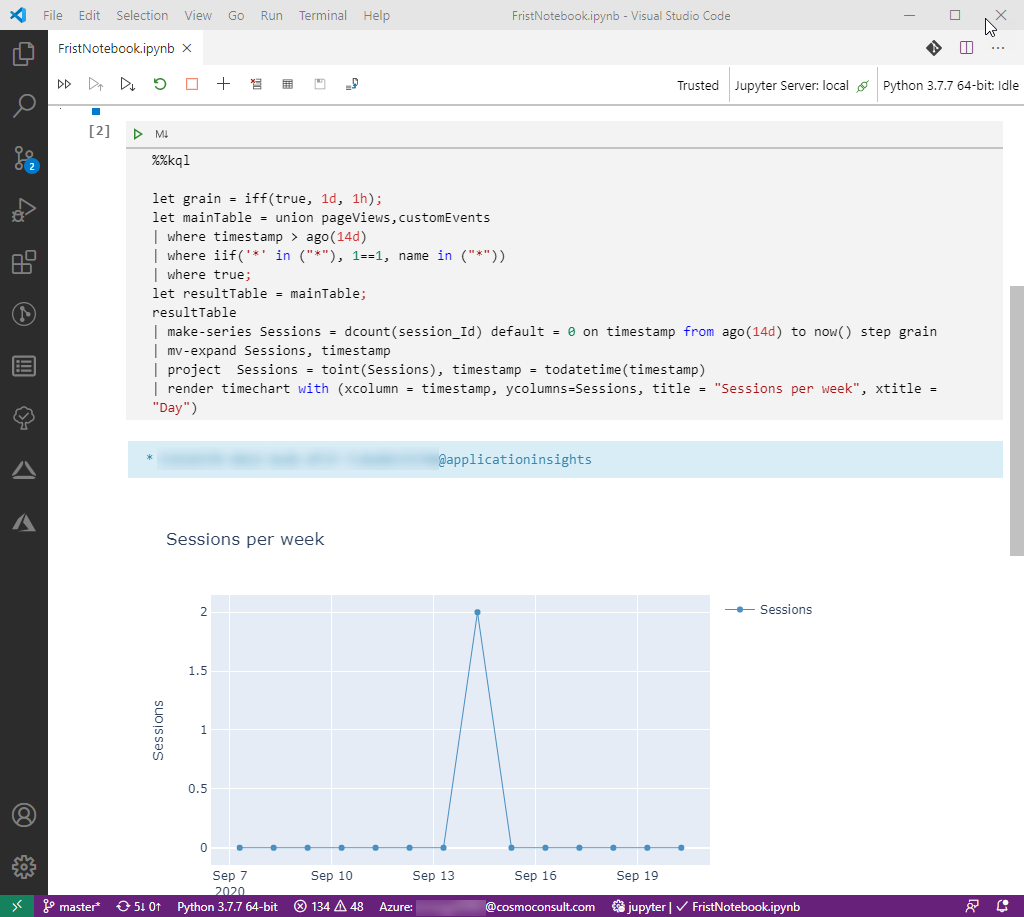
However, I was impressed 🙂
So, finally what is your preferred way to monitor and analyse Business Central telemetry information. Do you use Azure Monitor or Jupyter Notebooks?. Please send me your feedback as well as suggestions!
… Happy Sharing and don’t forget #NeverStopLearning