Monitoring Build Pipelines with Application Insights
Any kind of automation will lead into losing information about the magic in the background. You see only the results like “Build Succeeded” or “Build Failed”. That’s fine if you manage one or two Azure DevOps build pipelines, but this is terrible if you maintain hundreds or thousands!
What happens is predictable. If you don’t know what is going on in the background and what causes problems – you are in trouble. You have to investigate issues direct in each of your pipelines, because your colleagues rely on the stability and performance of your build automation.
As conclusion, I need centralized telemetry information from all of my Dynamics 365 Business Central projects in Azure DevOps. I want to know, when similar issues cause problems and I want to know my tasks with bad performance in my CI Build Pipelines!
With the introduction of Application Insights into Business Central Azure I realized, this could be a possibility to remove the “Blind Spot” from Azure DevOps and I started to “Tune” my pipelines.
Application Insights
Most of us know or have heard of Application Insights to capture telemetry information into Dynamics 365 Business Central. If not, I strongly suggest to follow these two links:
Let’s start with an brief introduction. Basically the Azure Monitor collect telemetry information for Web Services. In detail, this means Application Insights collect information about web requests & operations, failures, measurements, and log information in a database.
To include Application Insights, you can use many SDK’s that are available in almost all programming languages. Behind these SDK’s is a REST API that collects metrics. Finally, these metrics are categorized in the following topics:
- requests
- users & sessions
- page views
- custom events
- dependencies
- exceptions
- performance
- availability
Good news for Business Central Developers, Microsoft have also published an SDK for Microsoft AL at GitHub:
https://github.com/microsoft/BCTech/tree/master/samples/AppInsights/App
Under the bottom line, you are sending your telemetry information with any SDK means you call the Application Insights REST API.
Mostly such calls contains as payload:
- properties (dictionary of custom dimensions)
- measurements (per example durations, sizes, …)
- session information (user, device, browser, …)
Summarized, all these SDKs offer similar functionality to publish telemetry information into Application Insights.
Azure DevOps & Application Insights
When I look to my own CI pipelines then I see 3 main topics of interest. These are availability, avoid failures and improve performance to provide first class Azure DevOps magic for Business Central projects to my colleagues.
First of all, I need to ensure the availability of all CI relevant services like build agents, virtual machines or Docker SWARM environment & services. This means in other words: “No Builds without Build Agents & Infrastructure”
Secondly, I must react immediately, when my CI Start Task in pipelines start to fail. The reason could be a problem with one of the backend systems. Per example, my build agent is present but can not start the needed docker container. As result, I must investigate, when the amount of failures increase.
Finally I want to improve continuously my CI pipeline templates and scripts. Therefore I must measure and understand, which tasks and task groups can be optimized.
Monitor Infrastructure Availability
Our COSMO CONSULT product and project infrastructure services run on Azure and provide a REST API. The availability of this infrastructure is given, when the REST API is available by HTTP-Calls.
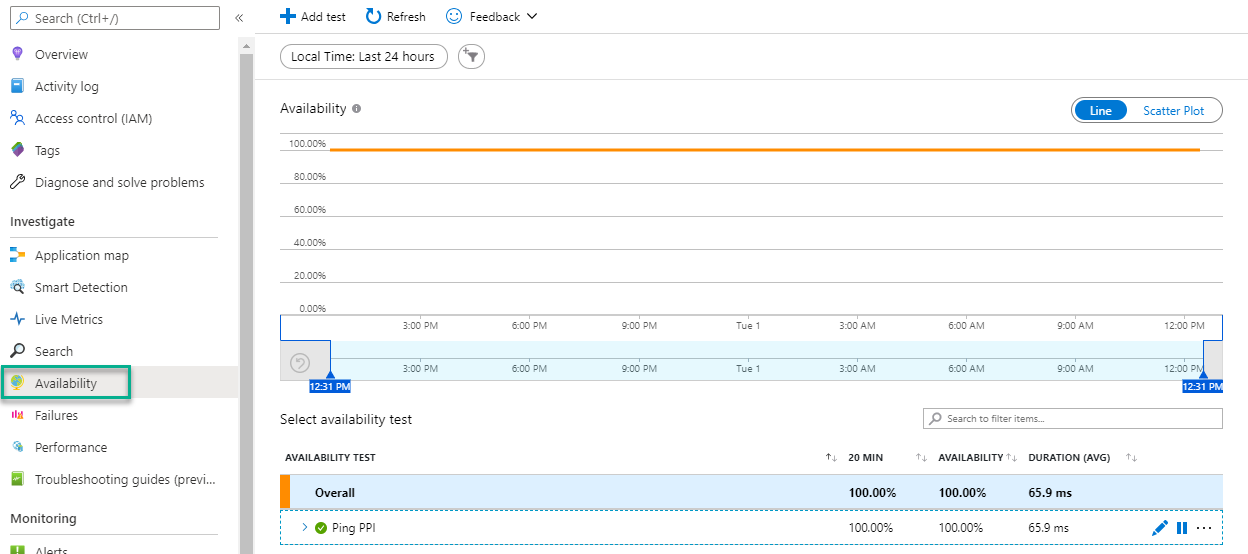
A simple, frequently sent ping to the service can be used to monitor the availability. As result, I have created and setup an availability test for our REST API:
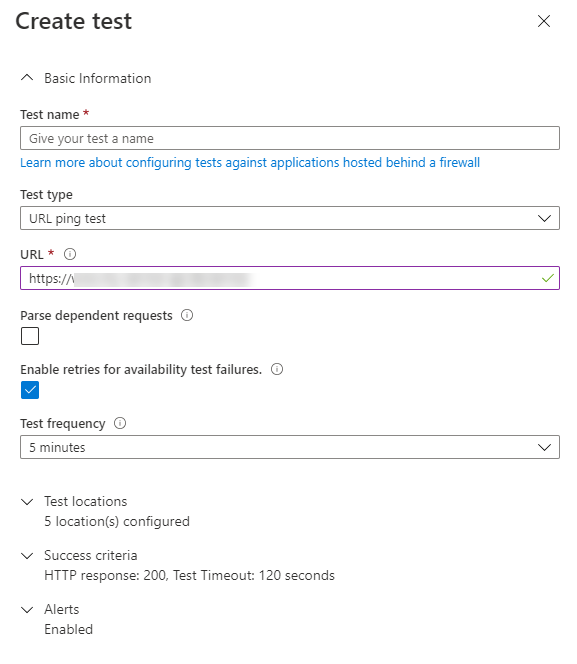
In other words my task one – “Monitoring of Infrastructure” – is accomplished, when I setup additionally the the availability test some alarms in Azure.
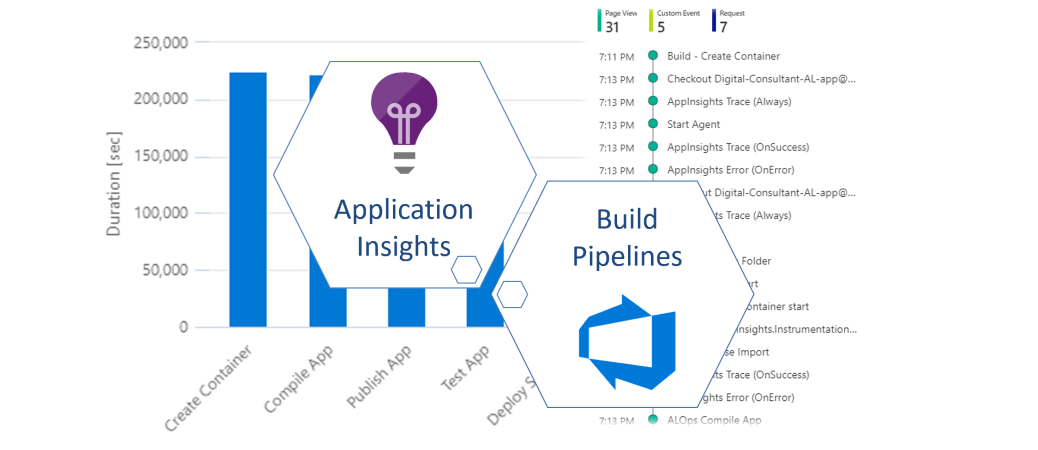
Collect Telemetry from Build Pipelines
My CI pipelines for Dynamics 365 Business Central projects uses multi stage pipelines based on templates. An example of the used stages during build is:
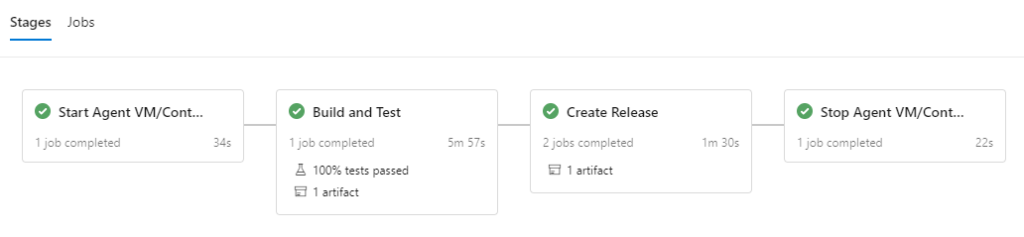
I use the stages “Start VM/Container” and “Stop VM/Container” to turn on/off the build environment to optimize resources and finally costs. The build environment is either hosted on an Azure virtual machine or provided at COSMO CONSULT as docker container service based on Tobias Fensters Docker SWARM environment.
The stage “Build and Test” contains my tasks to build and test the app. This phase consumes the most time per build. Therefore it obviously has potential for optimization. The resulting artifact is stored in an Azure DevOps artifact feed in a separate stage, because this is only necessary for my [master] branch builds.
In other words, when the Build Agents / environment fails to start I’m in trouble. Additionally I waste money, when the build environment fails to stop. And finally, I must identify optimization potential in stage “Build and Test” to optimize the performance.
In conclusion, I have to measure metrics and publish telemetry information in all these stages.
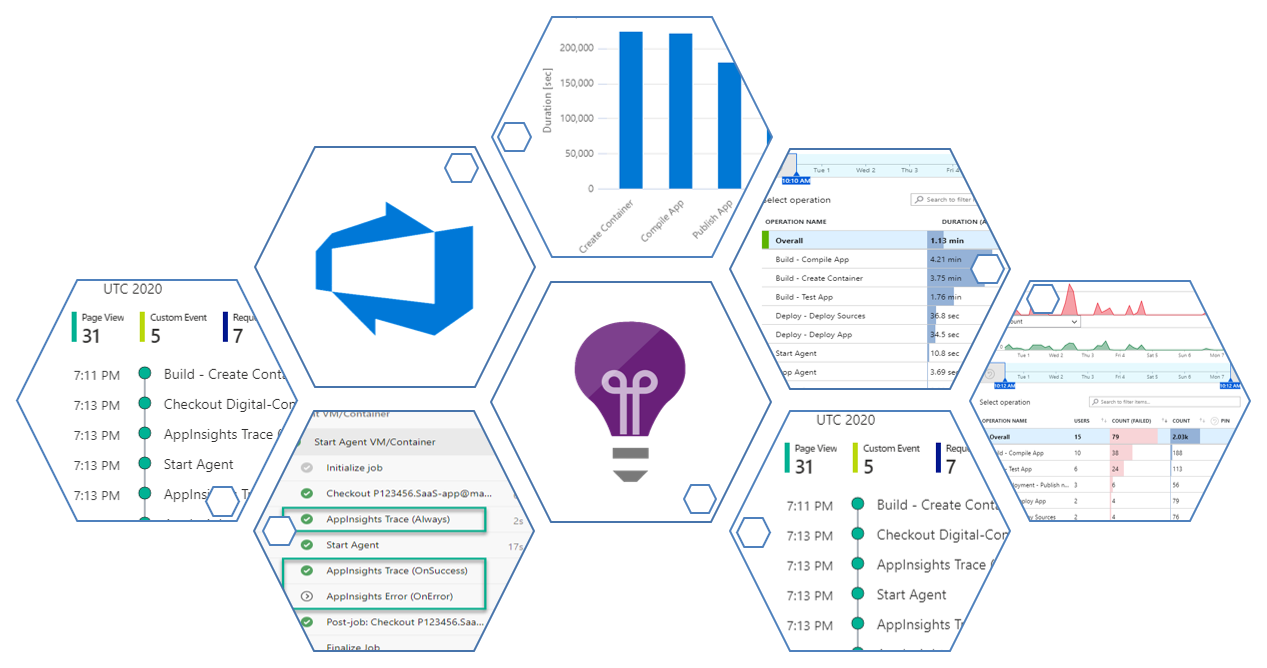
Start Agent VM/Container
I have added tasks in stage “Start Agent VM/Container” to collect information and publish metrics to Application Insights. As you can see, my “AppInsights …” tasks build a scope around task “Start Agent”:
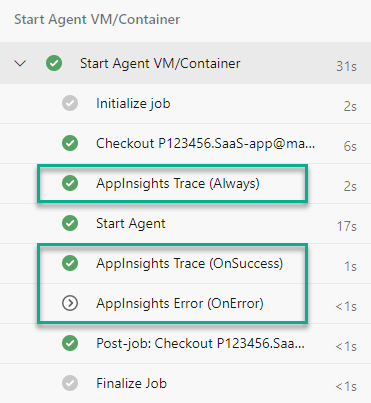
This is because, I collect 2 basic information – duration and success – from this scope. Both help me to answer the following two questions.
First I want to know how long it takes to start my build agent. Therefore I measure is the duration and I collect with the task “AppInsigths Trace (Always)” the start time.
The second – in my opinion more important – question is: Was the start of my build agent successful or not? For this my tasks “AppInsights Trayce (OnSuccess)” and “AppInsights Trayce (OnError)” are conditional. Both publish the measured time as well as the result success or fail to Application Insights.
Build and Test
My main stage “Build and Test” contains tasks that are categorized as follows:
- Start and prepare my docker container
- Install / publish needed dependencies like Add-Ins or Apps
(tasks are optional) - Compile & publish my app
- Compile & publish my test app, run tests and publish my test results
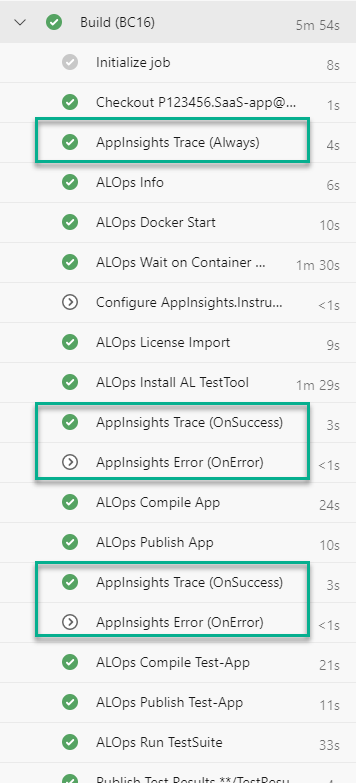
As you can see, I have used the same structure with my AppInsights tasks as in previously described stage “Start Agent VM/Container”. First I collect the start time (begin of my scope) and secondly I publish success or fail as well as duration metrics to Application Insights.
You might miss the “AppInsights Trace (Always)” for the 2nd and 3rd scope. This is because “AppInsights Trace (OnSuccess)” and “AppInsights Trace (OnError)” setup also the “start time” for the next scope. Therefore it is only needed at the beginning of a stage.
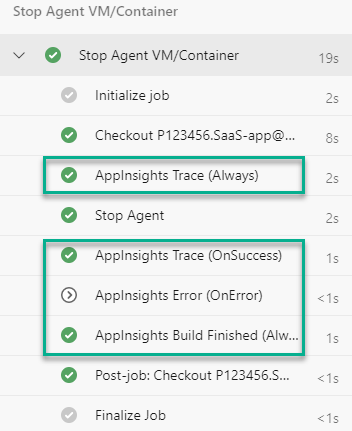
Stop Agent VM/Container
Finally my tasks in stage “Stop Agent VM/Container” are similar to the stage “Start Agent VM/Container”. The difference is the additional task “AppInsights Build Finished (Always)”. This task contains some special commands to trigger a service, which finally collect more detailed information about the build and timeline via REST API.
Publish Telemetry Information – “AppInsights Trace”
My task “AppInsights Trace …” publish collected telemetry information to my Application Insights component in Azure. For this I use per example a powershell script task, which:
- Create a Telemetry Client and initialize the context (session and operation)
- Setup a “Request” to collect my telemetry information
- Finally track (send) the “Request” to Application Insights
Param(
    [String]$InstrumentationKey,
    [String]$Name,
    [System.DateTimeOffset]$Started,
    [System.TimeSpan]$Duration,
    [bool]$Success         = $True,
    [HashTable]$Properties = @{},
    [HashTable]$Metrics    = @{})

# setup telemetry client ("*ApplicationInsights.dll" DLL must be present)
$telemetryClient  = New-Object -TypeName Microsoft.ApplicationInsights.TelemetryClient
$telemetryClient.InstrumentationKey     = $InstrumentationKey

# initialize context information
$TelemetryClient.Context.Session.Id     = "$($env:SYSTEM_TEAMPROJECTID)/$($env:BUILD_BUILDID)"
$TelemetryClient.Context.User.Id        = "$($env:SYSTEM_TEAMPROJECTID)/$($env:BUILD_BUILDID)"
$telemetryClient.Context.Operation.Id   = $Name
$telemetryClient.Context.Operation.Name = $Name

# setup request telemetry information
$request = New-Object -TypeName Microsoft.ApplicationInsights.DataContracts.RequestTelemetry
$request.Name       = $Name
$request.StartTime  = $Started
$request.Duration   = $Duration
$request.Success    = $Success

# copy properties and metrics
$Properties.Keys | ForEach-Object { $request.Properties[$_] = $Properties[$_] }
$Metrics.Keys    | ForEach-Object { $request.Metrics[$_]    = $Metrics[$_] }

# track the request
$telemetryClient.Track($request)
$telemetryClient.Flush()
In my example I initialize the context information with environment variables from my Build Pipeline. The reason for this is that I want to tell Application Insights that my pipeline behaves like a user navigating through a website.
As result, I can later use this context information to categorize my collected telemetry as well as to get a timeline (user flow) for my builds.

Analysing Collected Telemetry
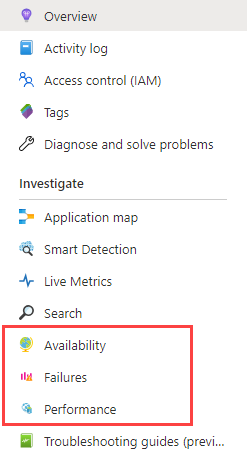
The Application Insights component in your Azure portal provide a couple of predefined views. “Failures” and “Performance” are prominent views to investigate related telemetry information.
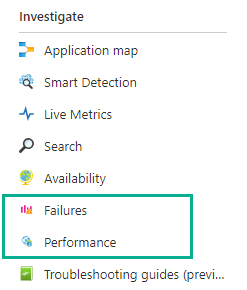
Both views visualize collected request information like operation name, success and duration from log source “requests”. This is per example one reason, why I submit my pipeline telemetry with “Track Request“ from my CI tasks.
Identify Problems
View “Failures” help me to analyse my pipeline issues. As result I get an overview of:
- Issues when “Start / Stop Agent VM/Container” fails.
… no Agent – no Build 🙁 - Issues when my app compilation fails or the app couldn’t be published
… no Build no App 😮 - Issues caused by failing test automation
… and a couple other problems like Create Container issues or problems during Artifact Deployment.
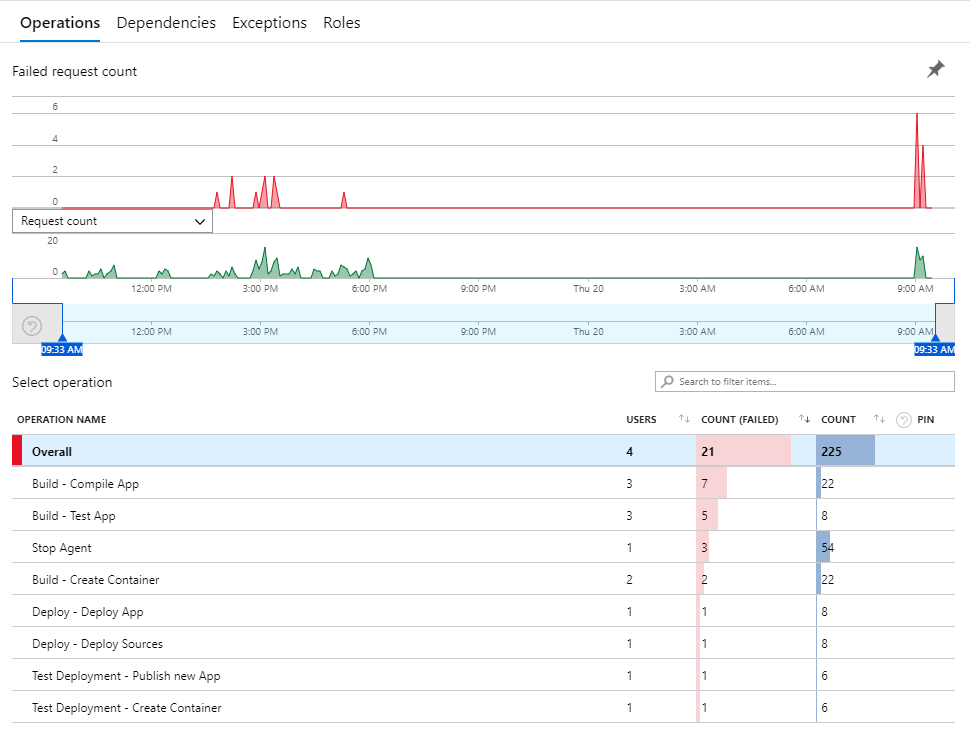
In other words, my main problems in my CI pipelines becomes visible within the “Failures” overview.
But wait, there are more information available. You can navigate to the logs by “View in Logs” and finally “Requests”:
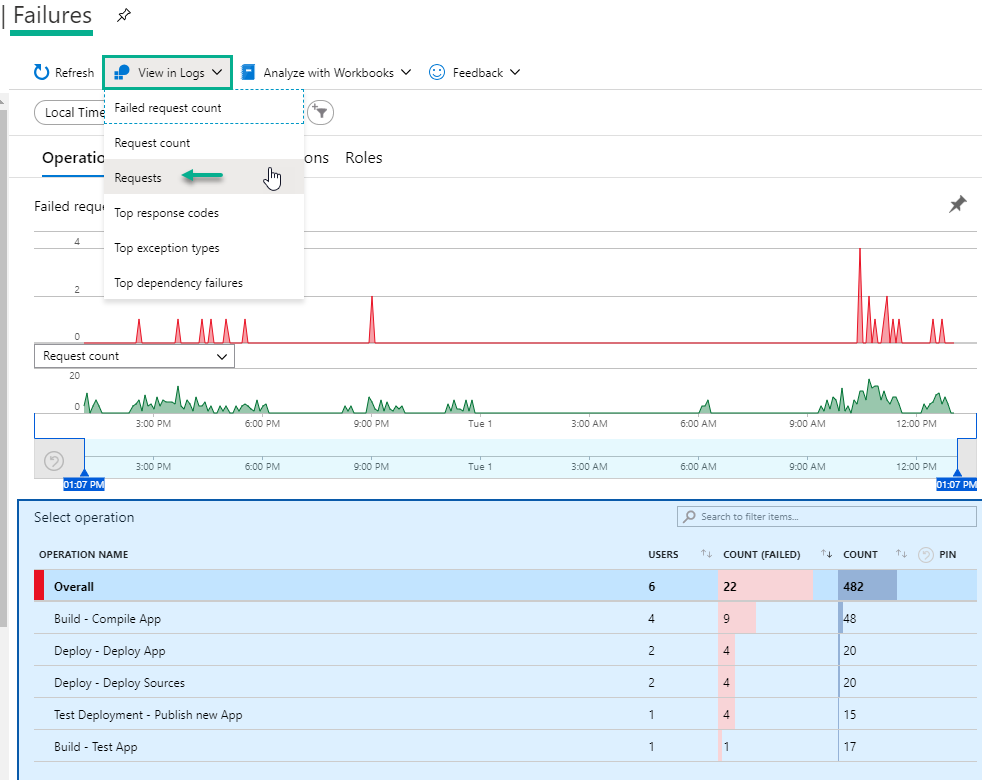
As you can see, the “Logs” view contains a query to collect and transform the log information written in Kusto Query Language:
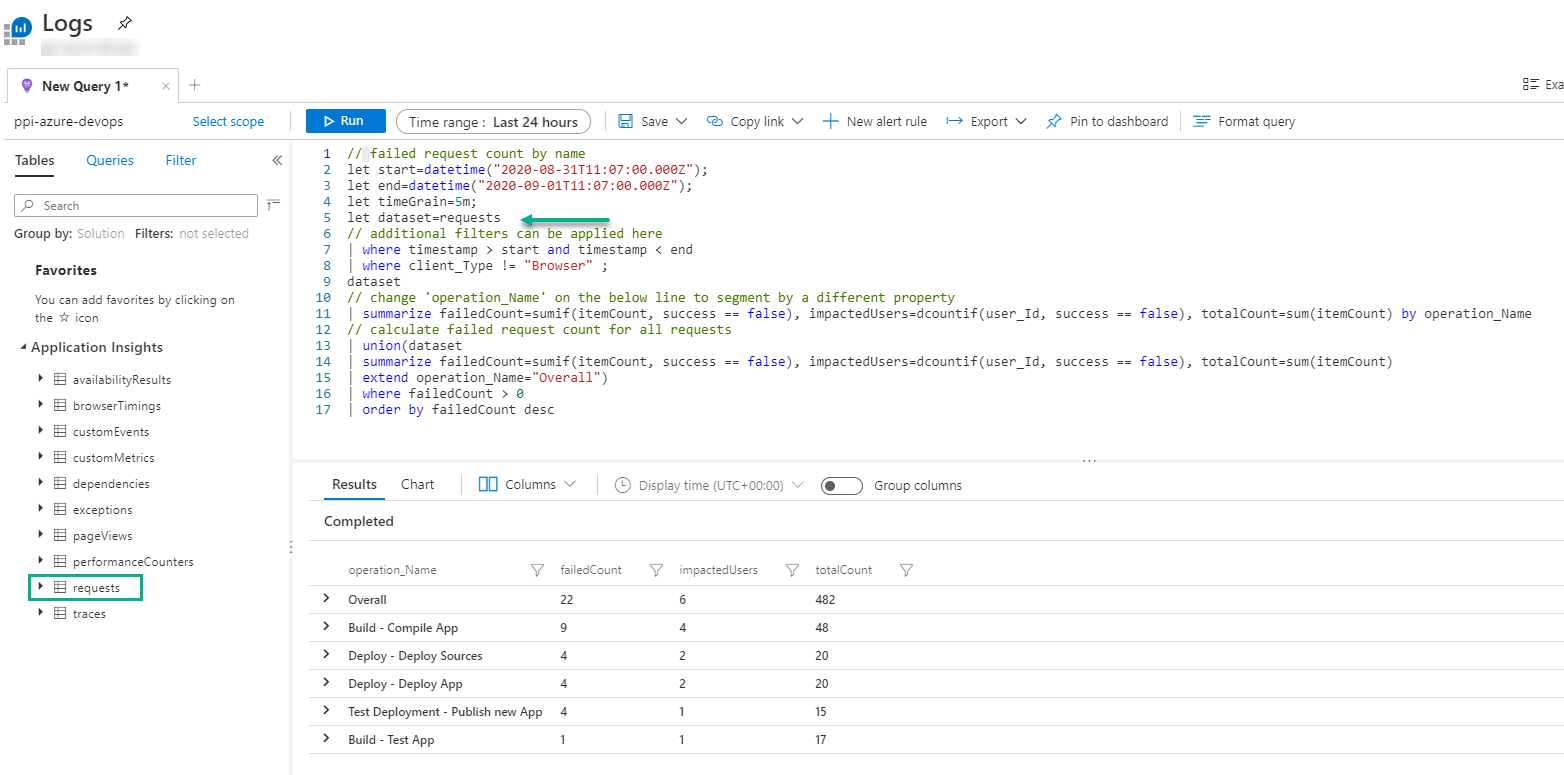
This is an option to get deeper insights with a little bit additional effort.
Identify Performance Bottlenecks
Another reason to use Application Insights was my question: How can I improve the performance of my CI build pipelines?
The view “Performance” in my Application Insight component give me some interesting insights about long running operations in my CI templates.
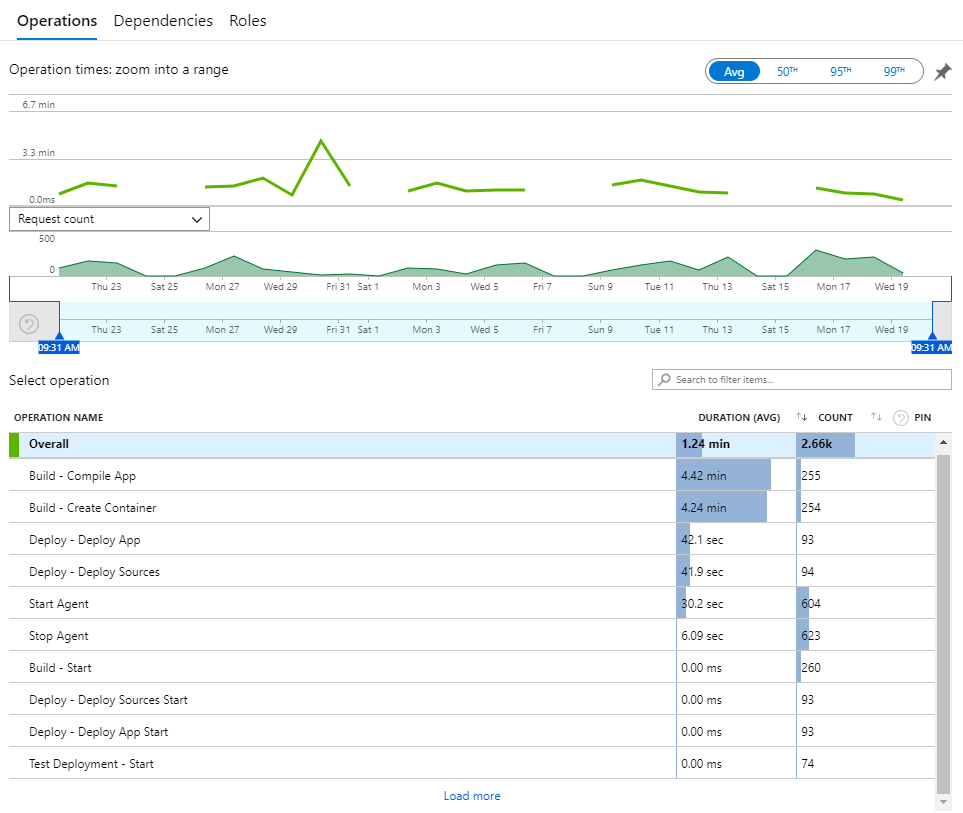
Here I find a summary of the average duration of my measured CI operations (scopes) like “Build – Compile App” and “Build – Create Container”. As you can see on the screenshot, my builds unfortunately waste most of the time with creating the build container and compiling the app.
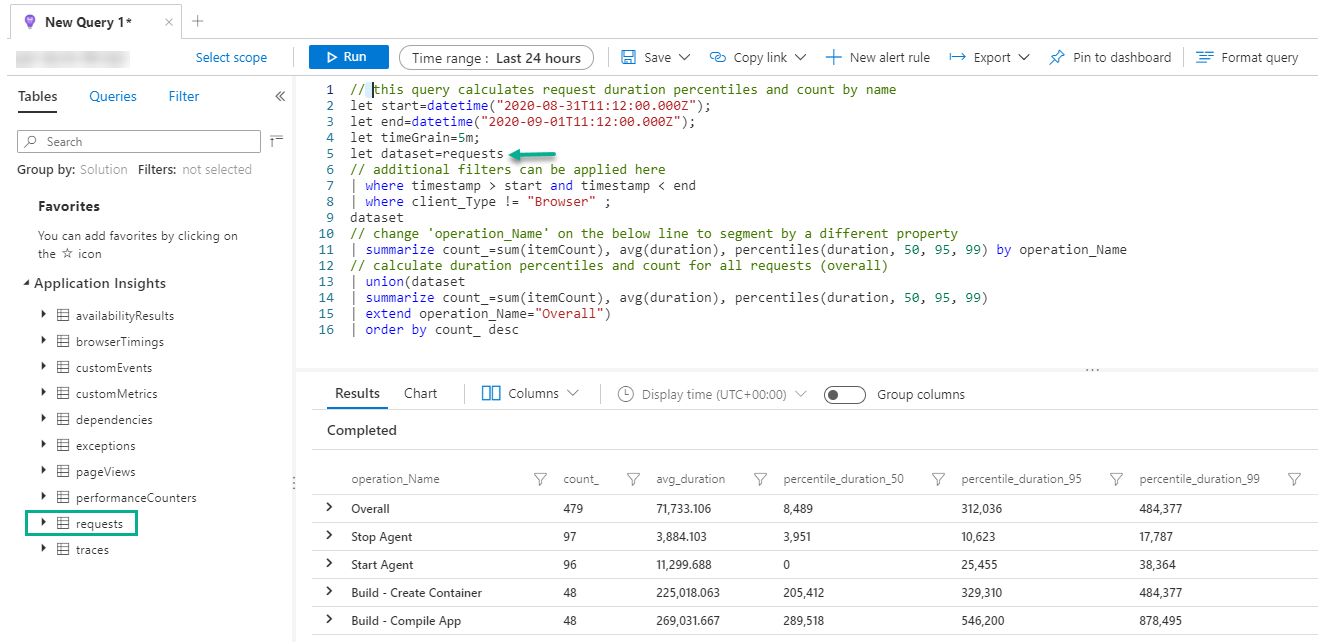
Similar to the “Failures” view, a deeper analysis is possible by navigation via “View in Logs” and “Requests”:
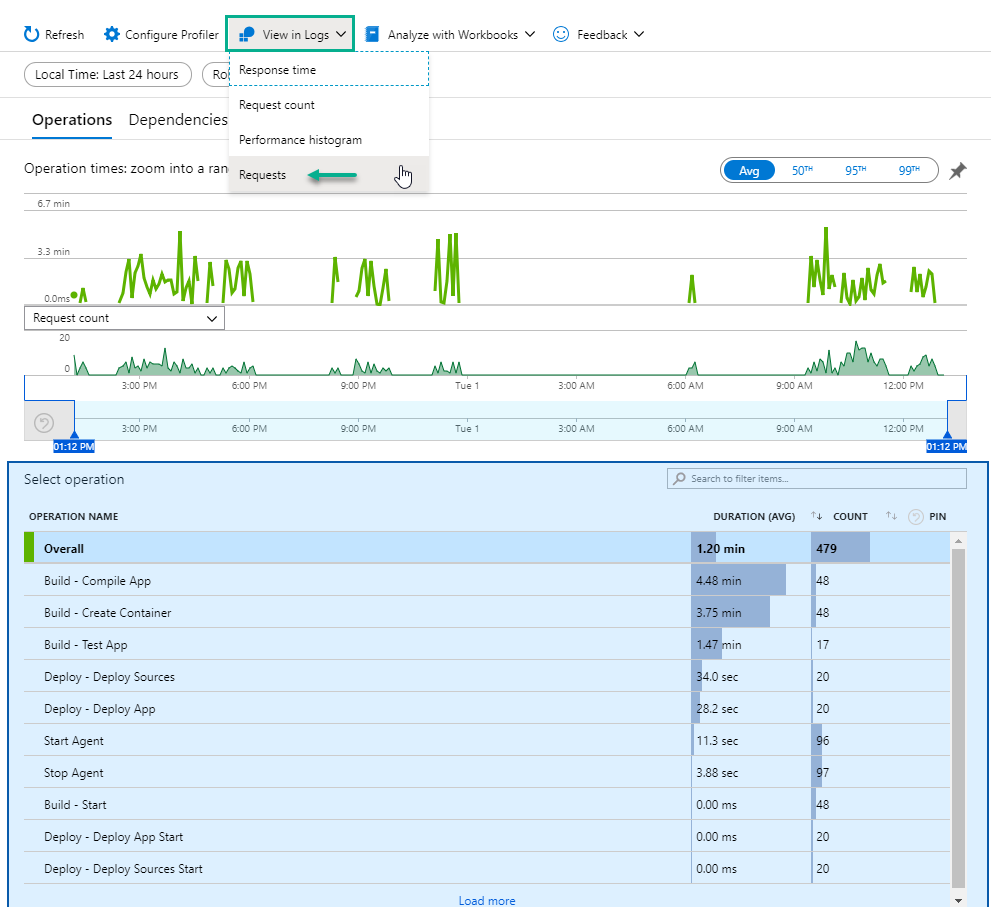
If you want, you can customize the query and include additional information from custom dimensions of used data source “requests”.
More Insights about pipelines and projects with KQL
It took a while I until first telemetry information arrived from in my integrated “AppInsights …” tasks in Azure Application Insights. Meanwhile I rolled out my test pipeline on other test projects and started some builds.
What can I say: I was totally thrilled after seeing the first information about task performance and failures with just a few clicks. In other words, now I was hungry to get deeper insights.
Yes, Kusto Query Language provide all what I need to aggregate and summarize my collected data. Additionally KQL helps me to visualize my results (rendering of charts) or export the query to Power BI.
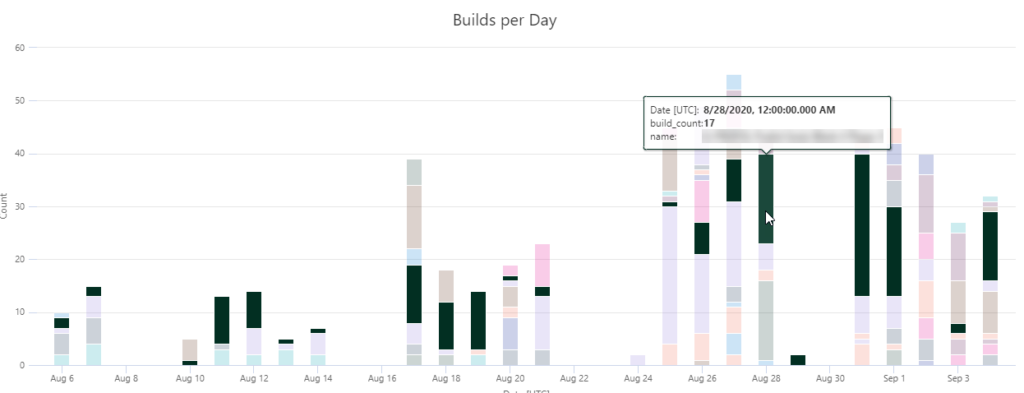
Builds per Day
As “warmup” I started to summarize the collected telemetry of my projects by “Builds per Day”:
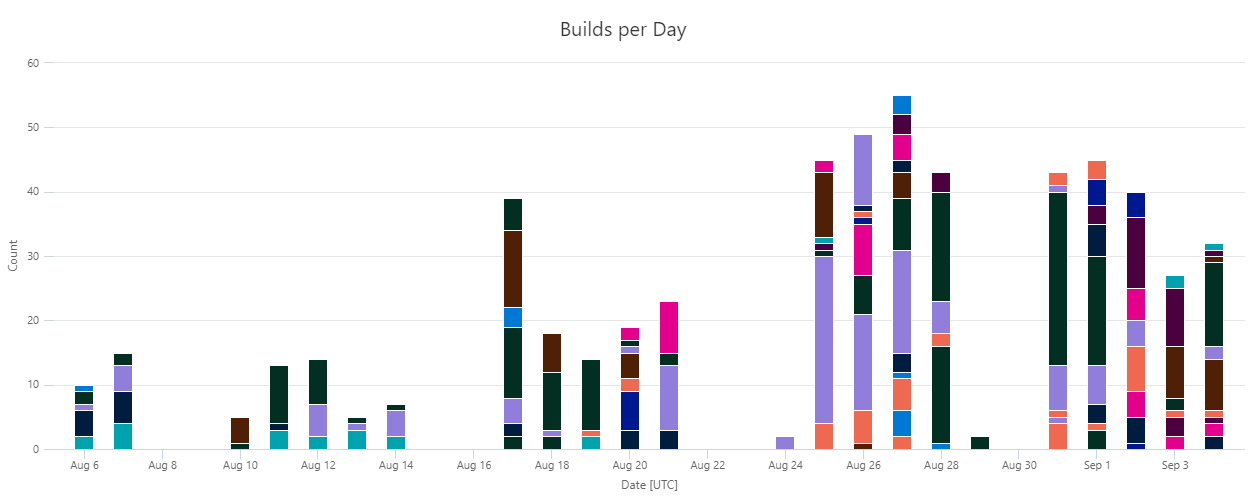
In this chart you can see my test period in the beginning. Later I got more build information after rolling out my templates in additional projects.
Selection of a project allows to analyse how many builds per day were triggered. In the future I will improve this query to get further information about the served projects.
Builds per Docker Images
Another interesting fact, the usage of docker images, became visible through Application Insights as I summarized my builds by the used docker image and summarized by the image kind.
As you can see, we use more custom docker images for older ERP system versions in build automation than plain Microsoft images. This usage changes to the opposite with Business Central 15 and 16.
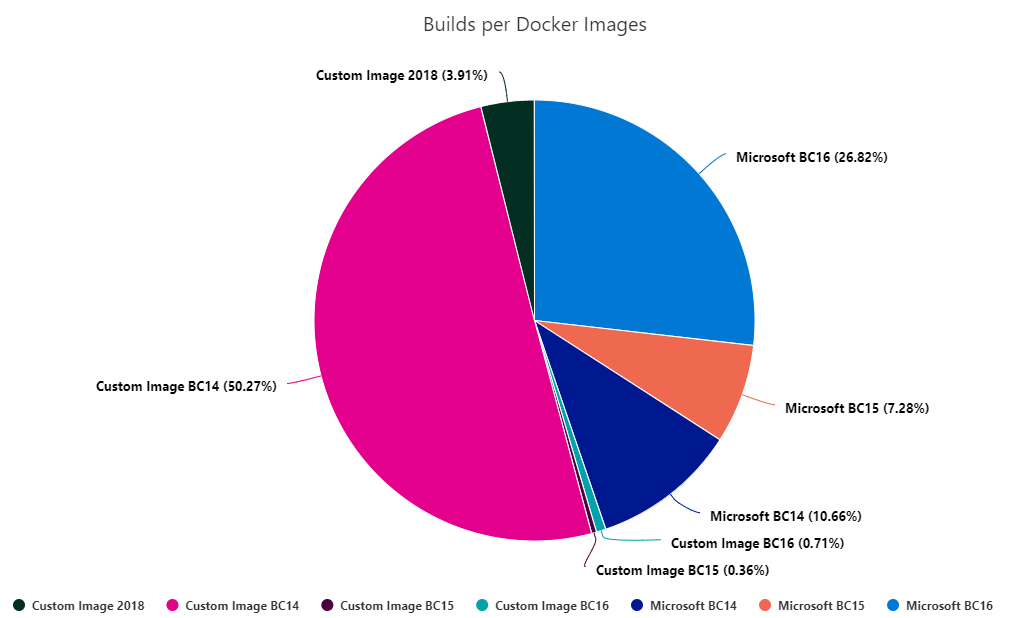
The reasons for custom docker images are well known. Often products integrated as FOB as well as required hybrid development for older versions (NAV 2018, BC 13 and BC 14) causes problems with symbol generation. Also the change to the opposite is explainable. Products in BC 15 or higher are apps and provide their own symbols.
Conclusion
Initially I gave you a brief overview about Application Insights and Monitoring possibilities. I also explained, why I started to collect telemetry information from my Azure DevOps build pipelines. Therefore, you know that my main concern was to ensure availability, avoid outages and improve the performance of my pipelines.
Secondly I have explained, where I include telemetry tasks into my build pipelines. In an example I showed you my PowerShell Task which publish the collected telemetry information to my Application Insights component in Azure. As a consequence my pipelines started to generate telemetry information with each build.
In the end I described how easy it is to analyze the collected data. I was able to see failures and performance issues direct in my Application Insights component. I also discovered Kusto Query Language is a great way to I got deeper insights, e.g. via “Builds per Days” or “Used Docker Images”.
What’s next?
How to continue? During this blog post I realized the power of Application Insights. It was completely overwhelming for me when I was able to analyze my pipeline telemetry information. This of course brought me to further ideas – so let me surprise you!
Do you measure and monitor your build pipelines? What information are important for you? Please send me your feedback as well as suggestions!
… Happy Sharing and don’t forget #NeverStopLearning
2 thoughts on “Monitoring Build Pipelines with Application Insights”
Excellent Blog post I was looking for this kind of setup and I will start to integrate this into my build pipelines.
#Neverstoplearning
Thx Morten!
Comments are closed.