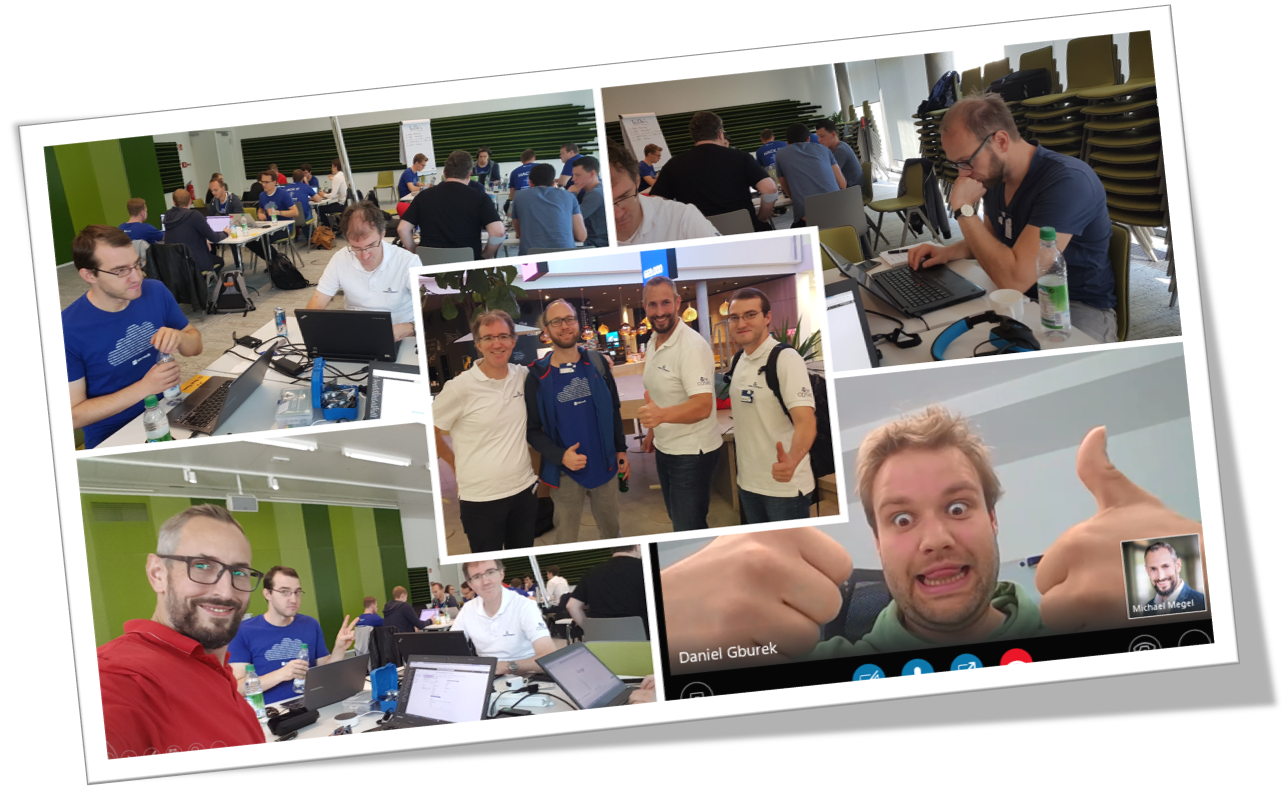
#AImeetsBiz – 48 Hours of Coding and Fun
One Team, one mission: Do something unbelievable within 48 hours … and YES, we did this at the Microsoft Hackathon in Munich!
Our plan was to build a platform-supported service. We have set ourselves a use case. An intelligent service must be created in an easy way and typical for use in manufacturing companies.
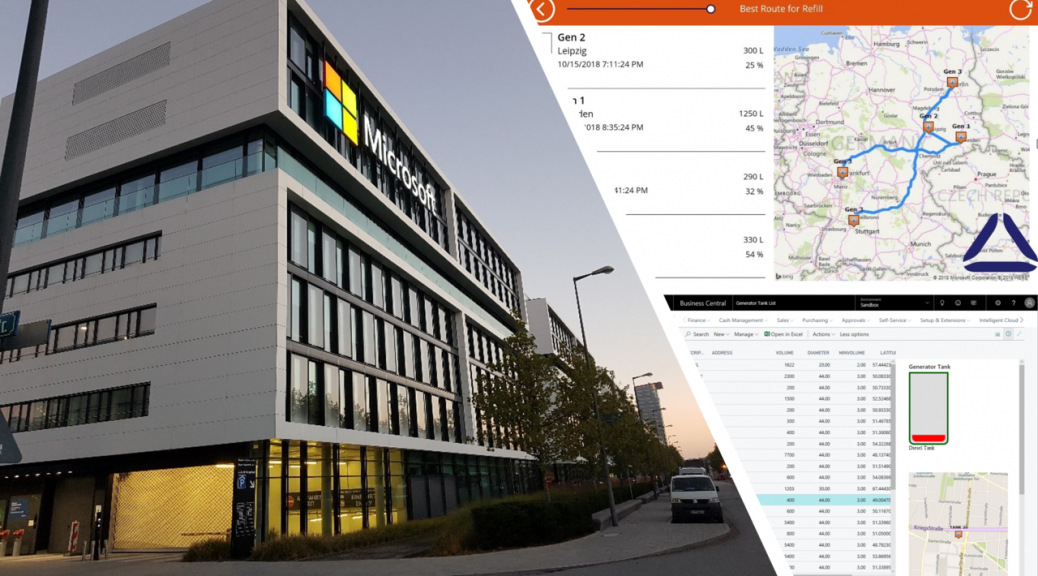
As example, we used a customer who build power generators. Tanks of a diesel generator must be regularly supplied with fuel. Tank monitoring with real time data access allows users to check fluid levels, across multiple sites and on all kind of devices. Combined with consumption forecast the inventory the process can be optimized in a predictive way. Nevertheless, securing power supply requires timely refilling.
Hey, come on – we can to do more than this! How about that? – To ensure an efficient use of several generators at multiple locations, the supply of the tanks in the network must be coordinated. This offers great potential in terms of resource optimization.
We add end-user services for predictive monitoring and efficient route planning, optimized for individual generator consumption as well as logistical peculiarities of the locations. It became obvious that such a service results in a lot value for all in the supply chain.
“Intelligent Tanks – Power as a Service” was born! Prediction for replenishment and intelligent route planning to keep powered! – Make our customer sexy for his customers!
Part 1 – IoT to Dynamics 365 Business Central
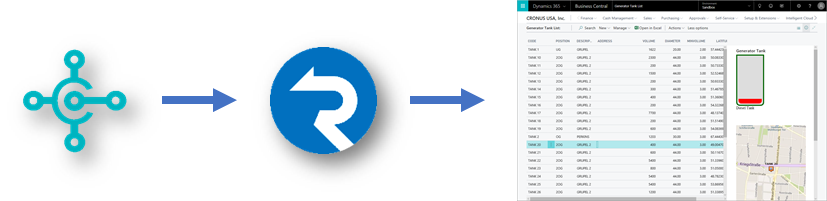
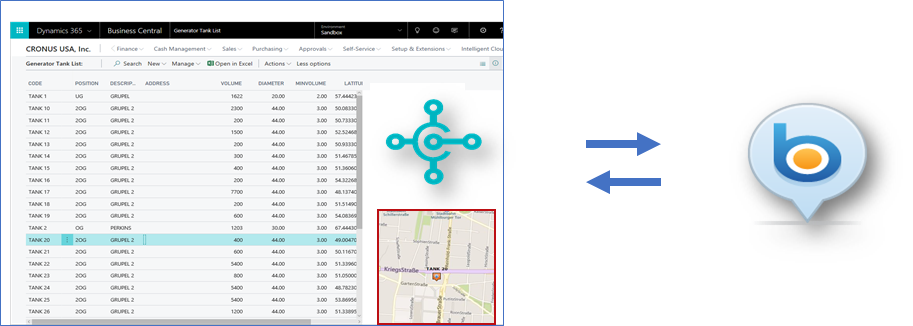
This is a classic scenario – the processing and visualization of real-time IoT information from the IoT device in Dynamics 365 Business Central. Available technologies – a chain of Azure IoT Hub, Azure Stream Analytics, Event Hub, Azure Function and modern API’s – to transfer the data to Dynamics 365 Business Central.

Once the data are there, it’s time to process and visualize. Control Add-ins in Microsoft AL offer a wide range of possibilities or visualization. Real-time notification for clients are added by using Azure SignalR Service into the solution.
Each of the generators have a location. Longitude and latitude can be sent by IoT or assigned in the ERP system based on a work order or service order. For visualization is Bing Maps for Enterprises a perfect choice. The API is easy to use, and the needed service can be added to an Azure Subscription.
Part 2 – Prediction and Planning
A perfect challenge for our data scientists and mathematicians’ geniuses. A good mix of simulation, mathematical models – of course, in R – and external data sources (weather and traffic) provides enough data for the first Azure Machine Learning. The prediction was ready after training of the initial models. A combination with route information of Bing Maps to improve the planning.

The prediction and planning is provided by an Azure Function and an Azure App Service. Data mappings and configuration inside of Dynamics 365 Business Central ensure the usability.
Now, the tricky part – registering the Azure App Service as a Custom Connector for PowerApps – seems simple, but sometimes there’s a devil in the Details. Especially if the App Service is in .NET Core 2.0 and you have to add your own Swagger definition.
Don’t ask, it drove me up the wall! @Microsoft – this need to be improved!
Part 3 – No Code – Low Code – PowerApp
My favourite during the hackathon! A good-looking, portable frontend can be created in minutes. Connected to the right services – if the Custom Connector works – the app gets all the information it needs.

The combination of Dynamics 365 Business Central, our Intelligent Service and Bing Maps in a PowerApp is awesome. Live generator information, fuel level forecasting and efficient route planning for tank replenishment are provided.
Summary
The use case was quite simple and our solution an outstanding “Hack” of our team! We visualized, real-time fluid level of tanks and located “diesel generators” in Dynamics 365 Business Central – again from IoT to D365BC. Behind the scenes, we used Azure Machine Learning to forecast the fuel consumption at multiple locations, weather conditions (historic / real-time) and characteristic consumption behaviour of individual generators. The Intelligent Service in the background consumed all this data, integrated Bing Maps route information, and provided an efficient route planning for refilling. Finally, a PowerApp – the customer view – displayed generators and tank information, the predicted fuel range, and an optimized route for efficient refilling.
All these things you expect from an Intelligent Tank Monitoring Service – MISSION accomplished!
We have used many cool Microsoft technologies. We barely slept but had a lot of fun! Thanks to my Team from Cosmo Consult!